Reflections on Attending RStudio Conference 2019 and the Diversity Scholarship
Jan 21, 2019 · 1731 words · 9-minute read
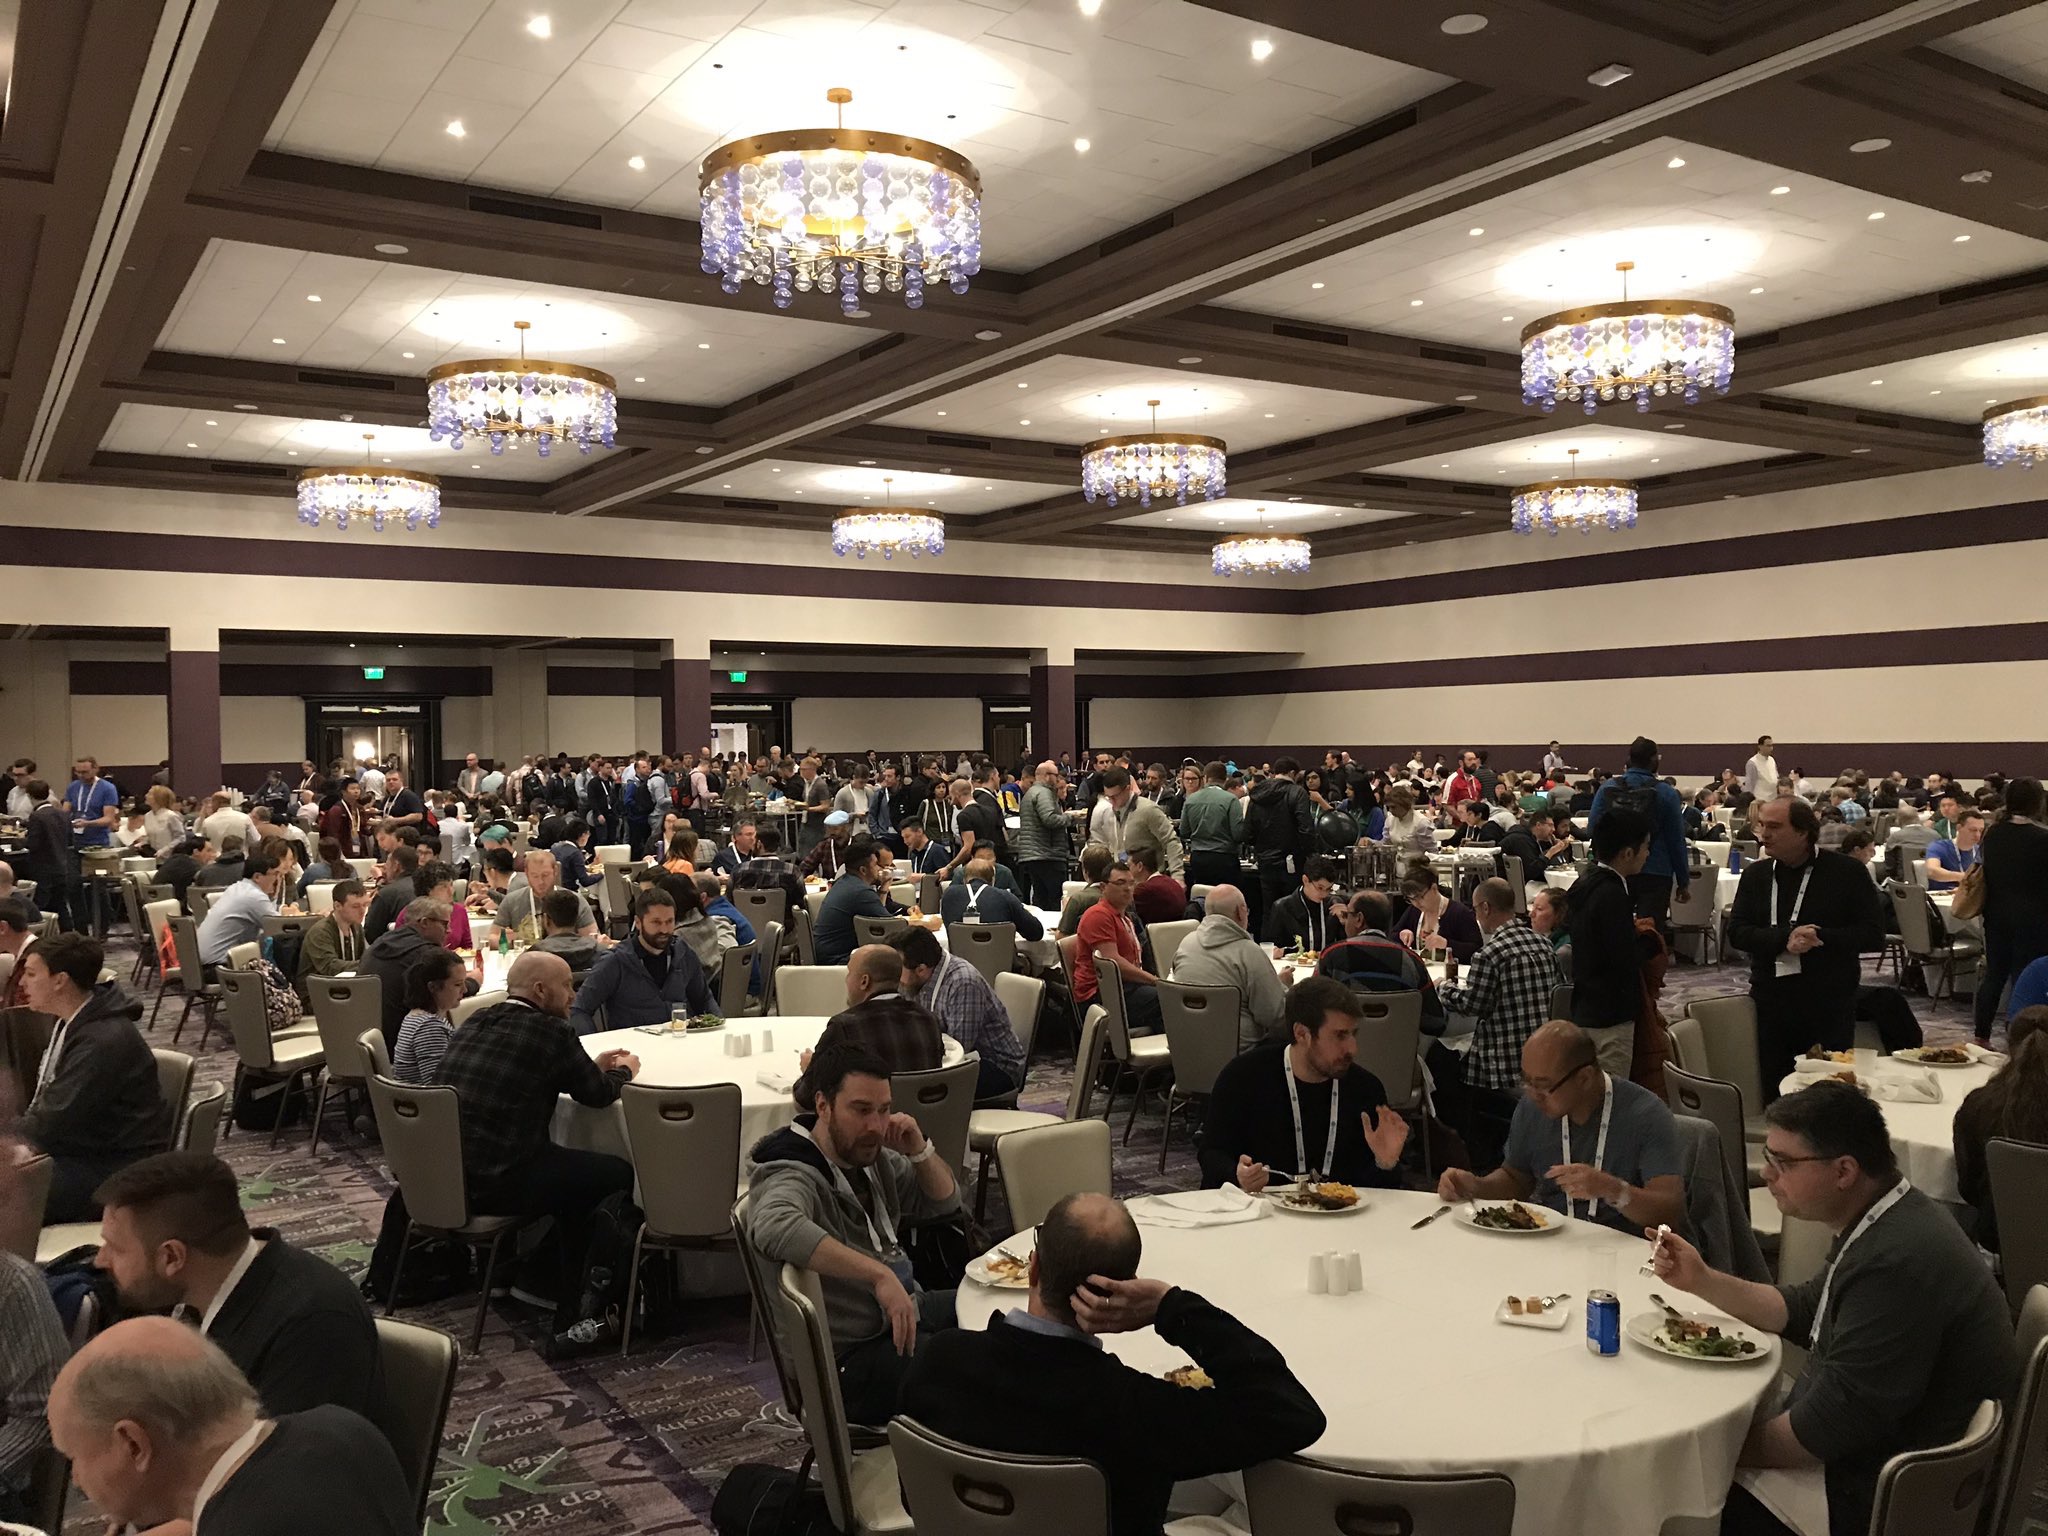
I was both excited and nervous about my first RStudio conference, which had just taken place in Austin, Texas. I was excited because RStudio kindly offered me a scholarship to attend, and I was nervous because most of the attendees were mid-career professionals with advanced STEM degrees – yes, I did make some charts and run some regressions, but my background still seemed insufficient for a conference of this caliber.
My fears and anxieties, however, dissipated after a few hours in Austin. Everyone I met was excited to talk about his or her work, some going to extreme length to explain what was probably the most basic aspects. The rstudio::conf crowd was the most diverse and supportive group I have ever met, and I truly hope every student who works with data, be he or she in the humanities, the social sciences, or any other discipline, gets to attend.
Diversity
When we talk about diversity, we typically refer to that in race and ethnicity, gender, sexual orientation, or (dis)ability. While minorities in these categories were well-represented at this year’s conference, I was most struck by the diversity in industry and methodology, i.e. what people collected data in and how people approached data analysis.
Diversity in Industry
Talking to people at the conference gave me a whole new perspective on “data.” A telling anecdote is that four fellow students who also received the scholarship all kept notes titled “Cool People I Met at the Conference.” Here’s my own, non-exhaustive list:
A senior data scientist at one of the world’s largest pump companies (yes, a company that makes water pumps)
This data scientist told me that his company’s senior leadership recognized the power of data and built a data science team several years ago for “predictive maintenance.” Hardware would be installed on all new pumps sold, and the data scientists at company headquarters would analyze when and where things were mostly likely to go wrong in the pumps.
I found our conversation fascinating because I had never thought that “data science” would be a possibility at pump companies, let alone the idea that the senior leadership of such a company would take the initiative. I also talked to the data scientist about compliance issues in overseas markets, since water usage could be a politically or commercially sensitive statistic.
The lead meteorologist at a renewable energy company
We struck up a conversation after I recognized the logo on his business card – it’s the same company that supplies the gas and electricity for my apartment.
The meteorologist said he collected minute-by-minute weather data and used it to predict the amount of energy that could be generated from wind and solar. It was very inspiring to hear him talk because his eyes lit up every time he started talking about the technical details of his work. “I’ve been wanting to do this since I was 14,” he said multiple times.
Private contractors conducting national surveys on behalf of the U.S. federal government
I met several statisticians and programmers working for a private company that conducted surveys on behalf of the U.S. federal government. As a student of social science, I had used several surveys conducted by this company, so there was lots for us to talk about.
Here’s a brief overview of their workflow: Once the company signs a contract with a branch of the government, the statisticians would work on the sampling strategy to ensure a nationally representative sample (often with oversampled minority populations). Field workers would then knock on doors to conduct the survey. Once the results are reported back to headquarters, a group responsible for data cleaning would clean the data (hats off to them!), and the statisticians would apply the appropriate weights. The company also had many full-time programmers who built internal tools for the statisticians.
Asked whether they had been affected by the recent government shutdown, they said that their own teams were doing okay but that some of their colleagues were told to stop working for now, since they would not be compensated for their work.
One statistician who worked mostly with health surveys shared many interesting stories regarding self-reported data. For example, she said that people routinely over-report height and under-report weight, so good health surveys now all require in-person visits by a field worker with measuring tapes and a scale.
Economists and data scientists at one of the U.S.' largest job sites
I got to meet five people from this company, all working in different roles. Some used the site’s job posting data to analyze the U.S. labor market, while others studied which employers were more likely to buy ads on the site.
I was most impressed by the diverse academic training this group had received. Only one of the five people I met had an economics degree. Others studied biology, sociology, law, and information studies. They said the company was very proud of building diverse teams.
The data analytics director at an international charity organization
I was surprised to learn that her organization had nearly 20 people working on data analytics. However, all they were tracking was the organization’s spending. The director lamented the lack of resources in her department and wished that her organization could carry out rigorous evaluations of its charity programs.
On the brighter side, the director said all the statistics was reported to her in a database that the company built a few years ago, so her team no longer had to deal with Excel spreadsheets!
Many others I do not have space to document
- A research analyst at a non-profit funded by the U.S. Department of Defense
- A data visualization consultant who visualized Canadian fisheries for local governments
- A lab scientist at a genomic lab who “probably ran millions of regressions a week”
- Marketers and software engineers at one of the U.S.' largest mutual funds
- I learned that there are rules in finance that prohibit marketers from changing the format of their performance reports to mislead customers
Diversity in Methodology
Besides the diversity in industry, I was also grateful for the diversity in methodology I was exposed to at the conference. The social sciences are primarily focused on causal inference, but speakers at the RStudio conference discussed many other approaches to data analysis.
Predictive Analysis
Mindlessly regressing y on x is a cardinal sin in any social science discipline, but at the RStudio conference, I saw many scenarios where this approach is not only useful but also superior to all the alternatives. For the lab sciences, it is helpful for identifying potential relationships that could be tested for causation at a later stage in randomized experiments. For marketers, knowing that “A is a good predictor of B” is probably sufficient in many circumstances.
A/B Testing (or Online Experiments)
Social scientists conduct experiments as well, but the data science teams at Internet companies seem to have a different focus. Online A/B tests such as changing the color of a button is a lot less messy than the experiments many social scientists conduct in the field, so the identification is more straightforward. Instead, data scientists at Internet companies are more interested in:
- Building the infrastructure and fully automating the workflow so that A/B tests can be conducted in a consistent manner rather than on an ad-hoc basis;
- Improving the data literacy of non-statisticians such as designers and product managers so that they can commit to a pre-analysis plan and not vary the duration of the experiment once the experiment has started.
Descriptive Analysis
Brooke Watson, a data scientist at the ACLU, gave a moving presentation on how her team collected the data on the children that had been separated from their parents at the border. For several weeks, she was getting Excel spreadsheets about these children from co-workers and collaborators around the country, often with different column names and missing data here and there. Her team spent months cleaning and validating the data (but probably still missed a lot of children).
Although all her team was able to produce was descriptive statistics on a subset of these children – their age distribution and current location – it was nonetheless crucial for the public understanding of the crisis. Ms. Watson said legislators from across the country called to get more information, and lots of citizens were inspired to act.
I gained a new appreciation for descriptive analysis after listening to the talk. It reminded me of social scientists who spend years and even decades working through archival sources and creating original datasets from material they saved from the dumpster or found in a neglected corner of the local library.
Although 99% of our time is spent on data entry and data cleaning, we don’t typically get credit because they are seen as “mechanical” work that lacks the rigor of a statistical model. But in reality, the tenacity that’s required to plow through the grunt work is commendable in and of itself. Knowledge can be found in models and code, but it can also be found in an Excel spreadsheet or a chart of summary statistics. The marginal gains from gathering, cleaning, and sharing data is probably greater than those from building another fancy model.
Inclusivity
I’m not going to detail the free career advice and generous emotional support people at the conference gave me. I will say, however, that the organizers made a great effort to create a collegial, inclusive environment.
Hadley Wickham, the host of the event, said during his keynote that we should always form a “Pac-Man” circle so as to leave some space for others to join an existing conversation. That is what exactly many groups did during the conference.
A code of conduct was repeatedly brought up by the organizers, and attendees were all given information on who and where to report should any unpleasant incident occur. I also saw people using the Mother’s Room at the conference, and the lunch the organizers put together for scholarship recipients was also very well received.
All of the above are commendable practices I hope other conferences would adopt. Finally, there were the throw-able microphones that greatly sped up the Q&A process. I definitely recommend it anyone to hosting large events!
Apply for the scholarship!
The next RStudio conference will be held in San Francisco in January, 2020. The scholarship application opens in August, 2019 and closes mid-September. Please apply and have fun!