Growth Rates with Chinese Characteristics? The Curious Case of China's Industrial Profit Statistics
Jul 5, 2018 · 568 words · 3-minute read
China’s National Bureau of Statistics (NBS) reported on June 27 that the country’s industrial profits in May surged by 21% year-on-year. The figure was then, of course, faithfully broadcast to the world by the likes of Bloomberg, Reuters, etc. But in a now deleted social media post (archived here), a Chinese blogger noted that if we compared the raw industrial profit statistic provided in the same press release with that from May of last year, we would, in fact, obtain a drastically different number: -6%.
The post quickly gained traction, with netizens accusing the NBS of fraud (and the very stupid kind). The NBS was apparently concerned enough that it clarified to the press on two separate occasions.
So what explains the discrepancy? NBS officials cited methodological reasons.
China’s monthly industrial profits report, similar to the US Census Bureau’s Quarterly Financial Report, covers entities of a certain scale. (In China, they are businesses with annual revenue above 20m yuan; in the US, they are corporations with total assets above $250k.) Understandably, some entities that fall above the threshold in one year may fall below in the next year. China’s NBS thus concludes that in order to make apples-to-apples comparisons, it should not calculate the year-on-year percentage change by simply comparing this year’s figures with last year’s.
Instead, the NBS says it should look at businesses that are in both this year’s and last year’s dataset. The difference between the sum of their profits is the “growth in industrial profits” we are looking for.
Many find the NBS' explanation absurd. In the comment section of the now deleted social media post, one posed a hypothetical: If the economy suffers from an unprecedented shock and only one business has revenue above the threshold, would the fact that this single company’s profits increased mean that the entire country’s industrial profits have positive growth? That certainly seems to be the case if we apply the NBS' methodology.
Absurd or not, the NBS' method is surely not the convention. Compare the US Census Bureau’s 2018-Q1 and 2017-Q1 Quarterly Financial Reports, and we will find that the 2018-Q1 report references the 2017-Q1 statistic as reported in the 2017-Q1 report. There is no “readjustment” based on the fact that some corporations have fallen below the asset threshold.
And even if we accept the NBS' explanation, another mystery remains unsolved – the NBS claims to have adopted the “readjustment” methodology since at least 2015, but the discrepancy between the conventional way of calculating year-on-year change and the NBS' emerged only this year.
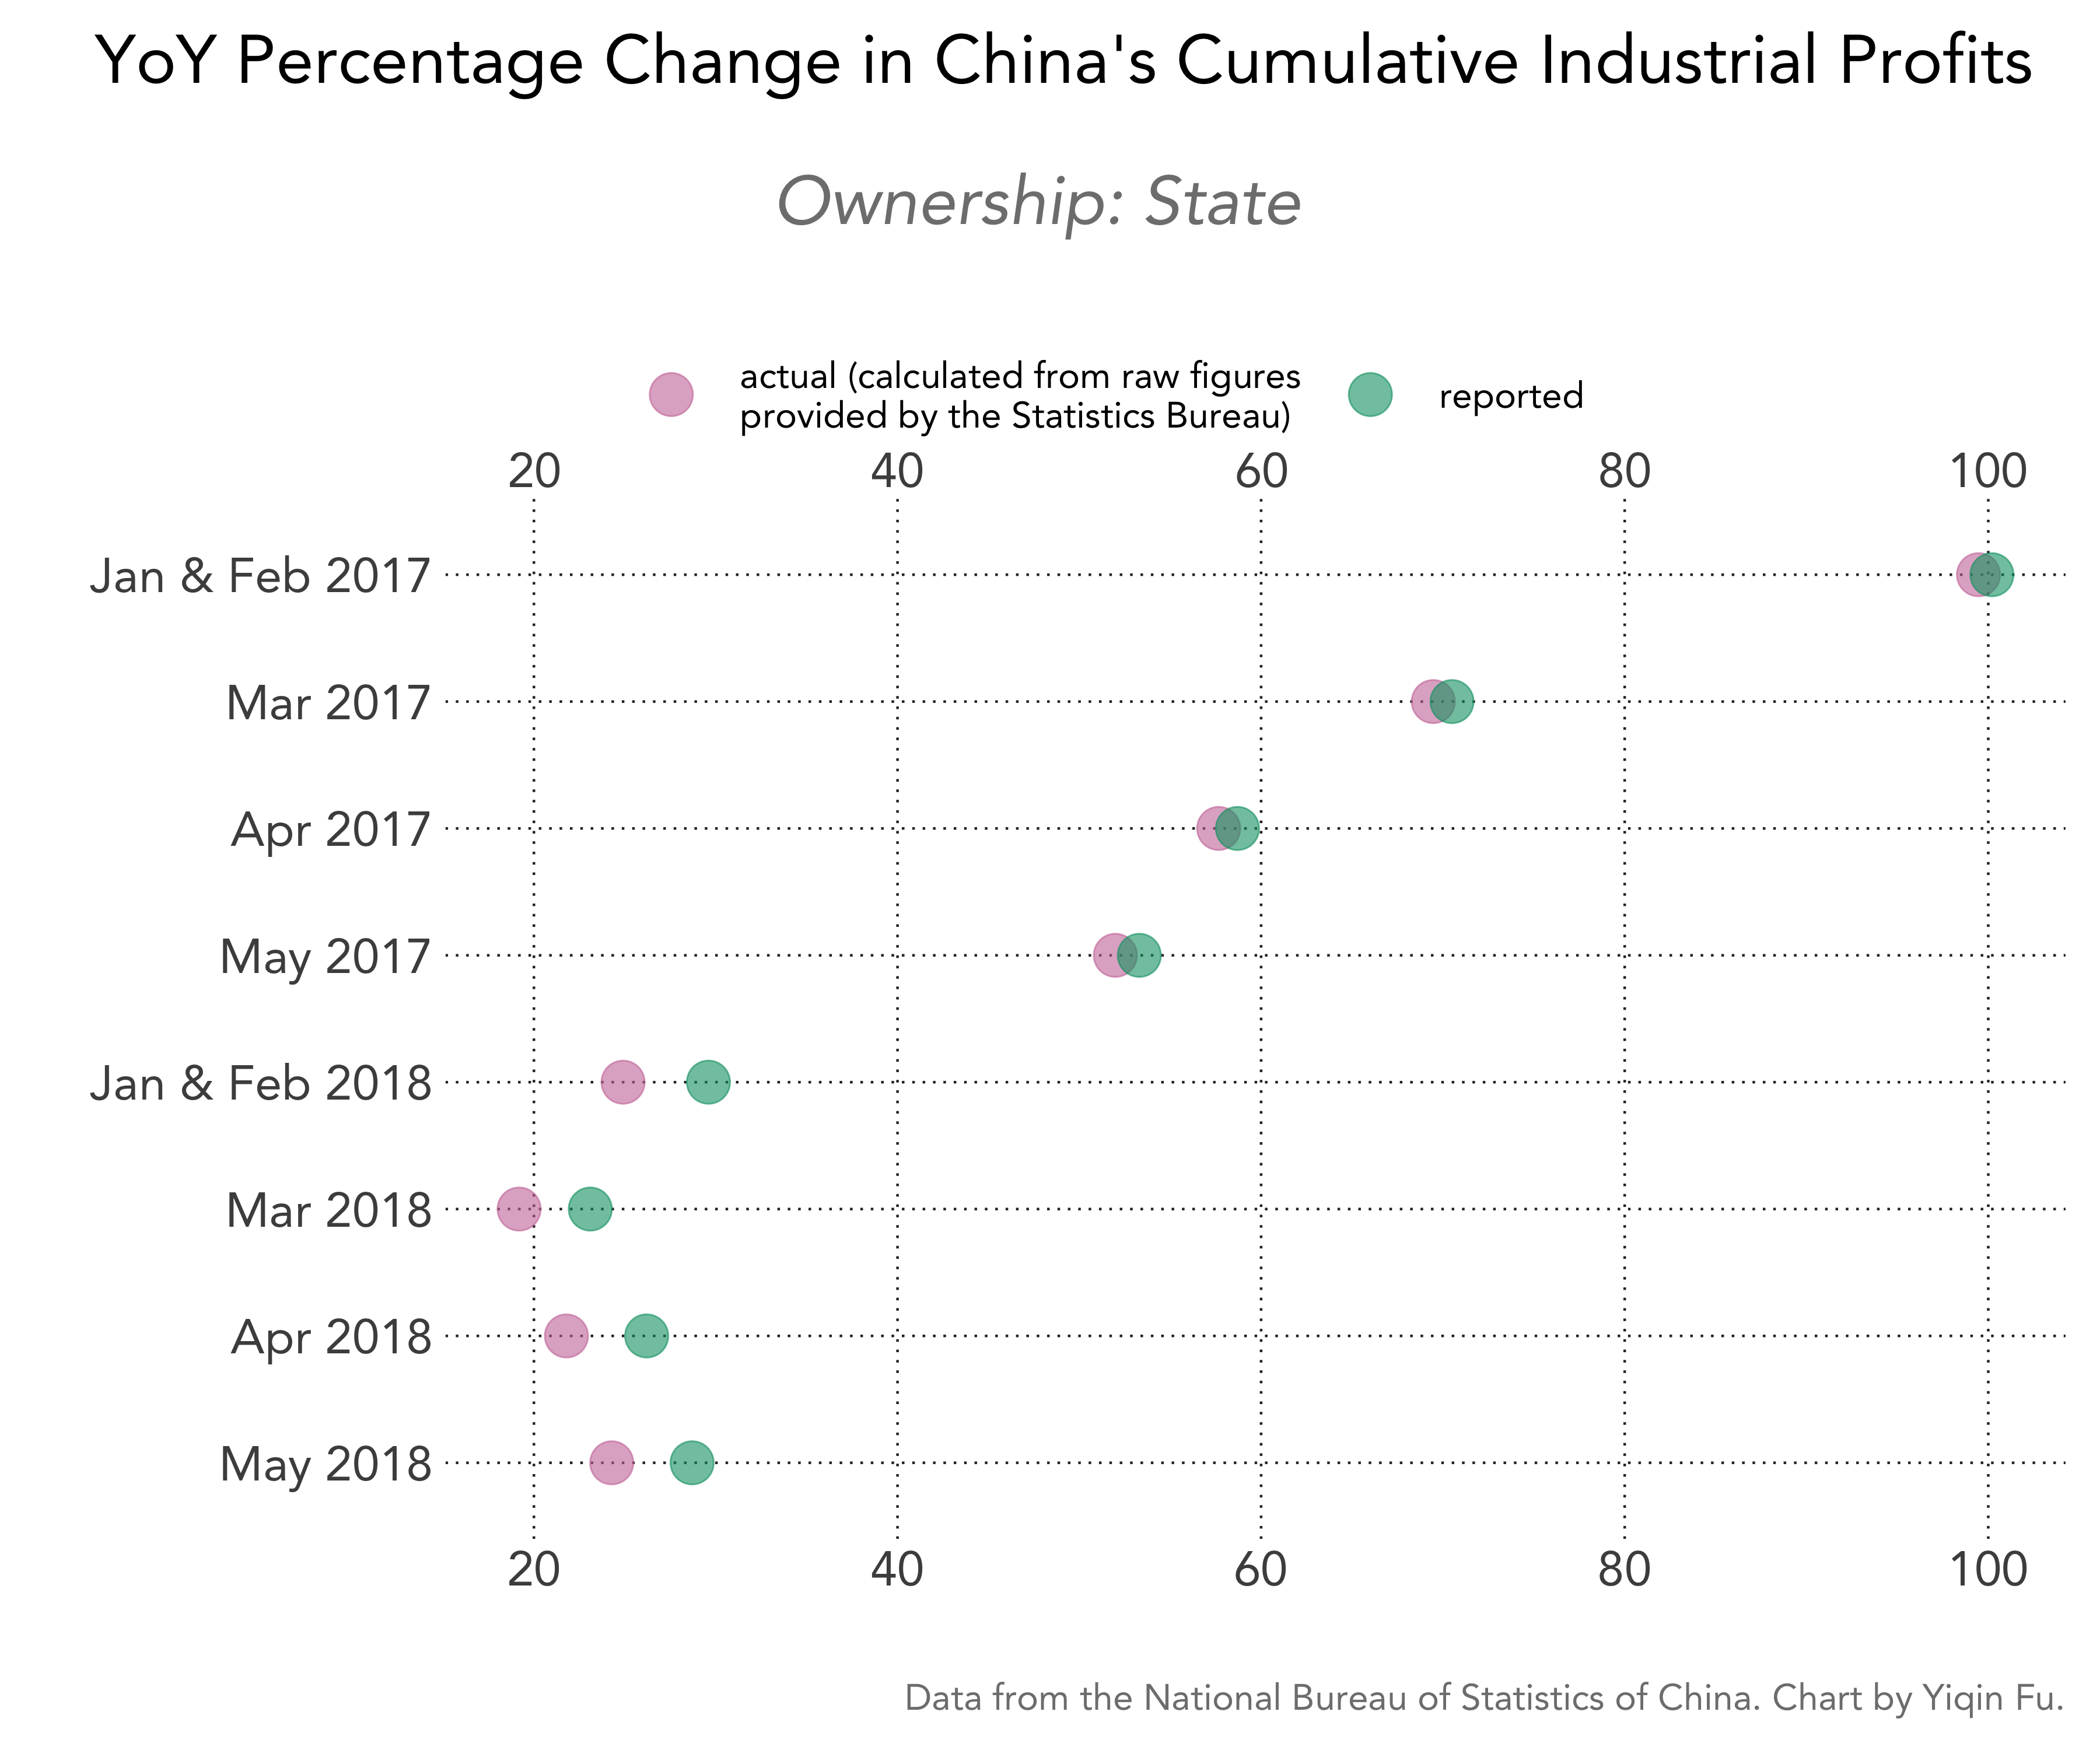
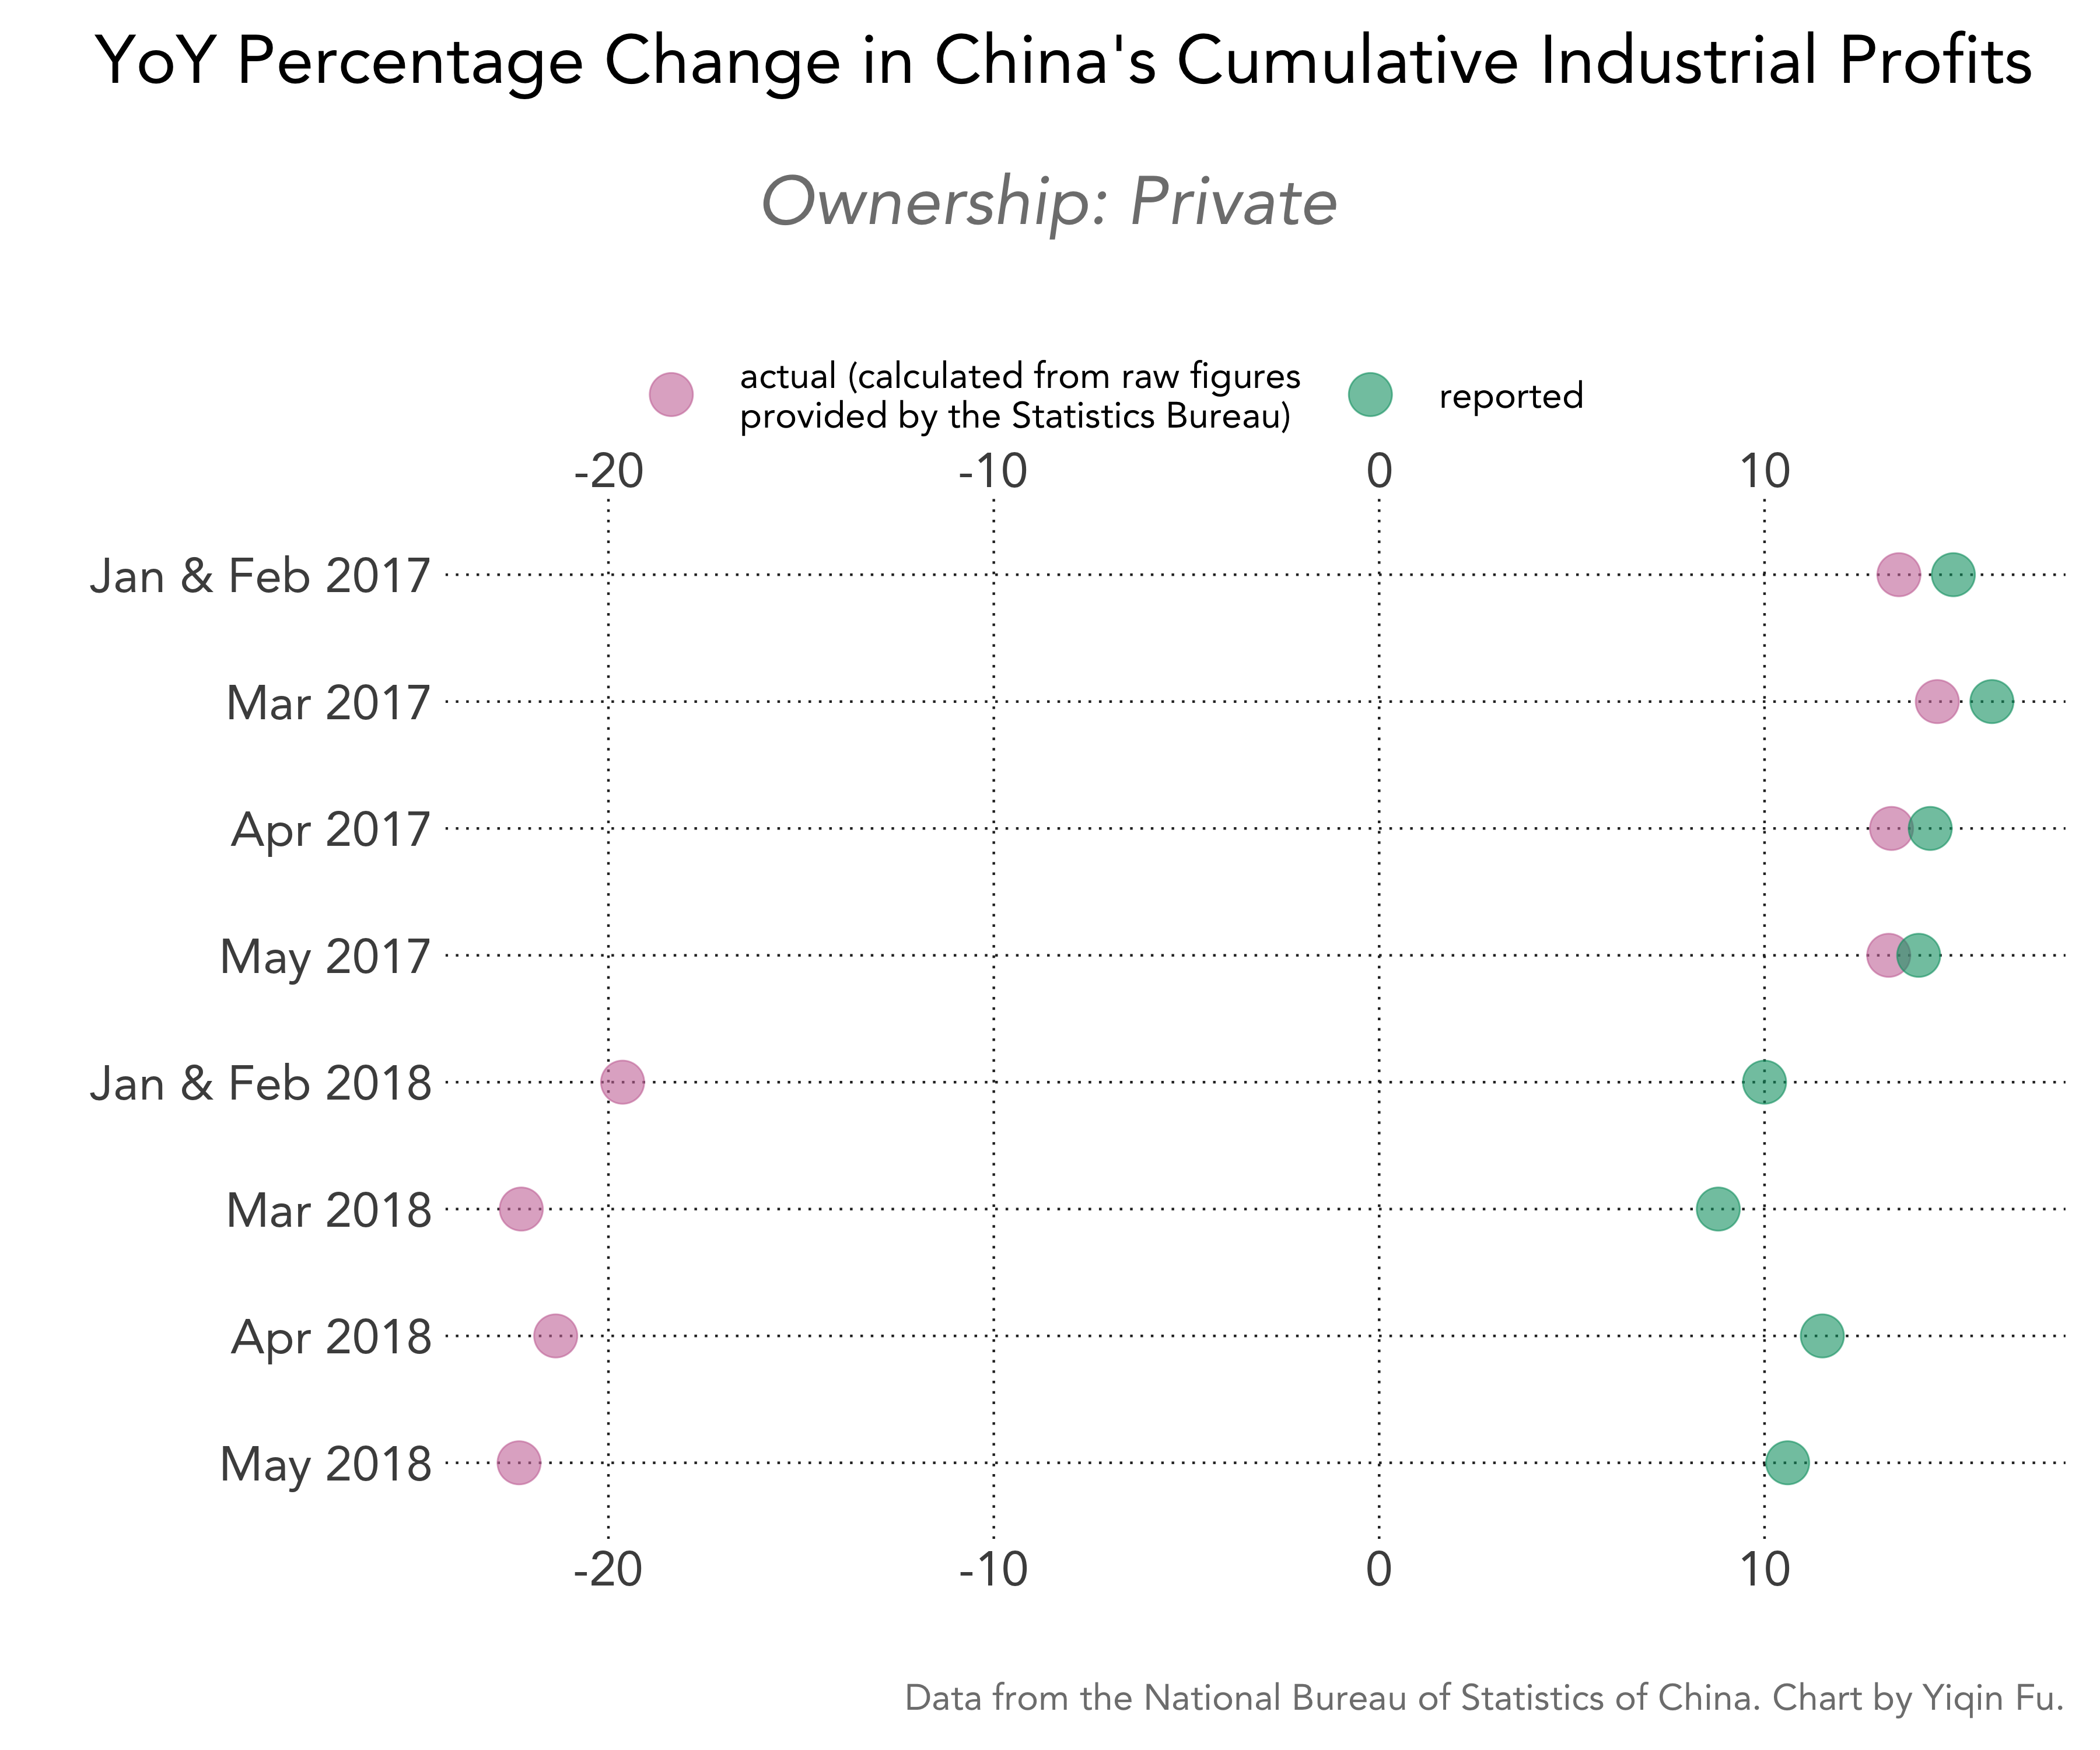
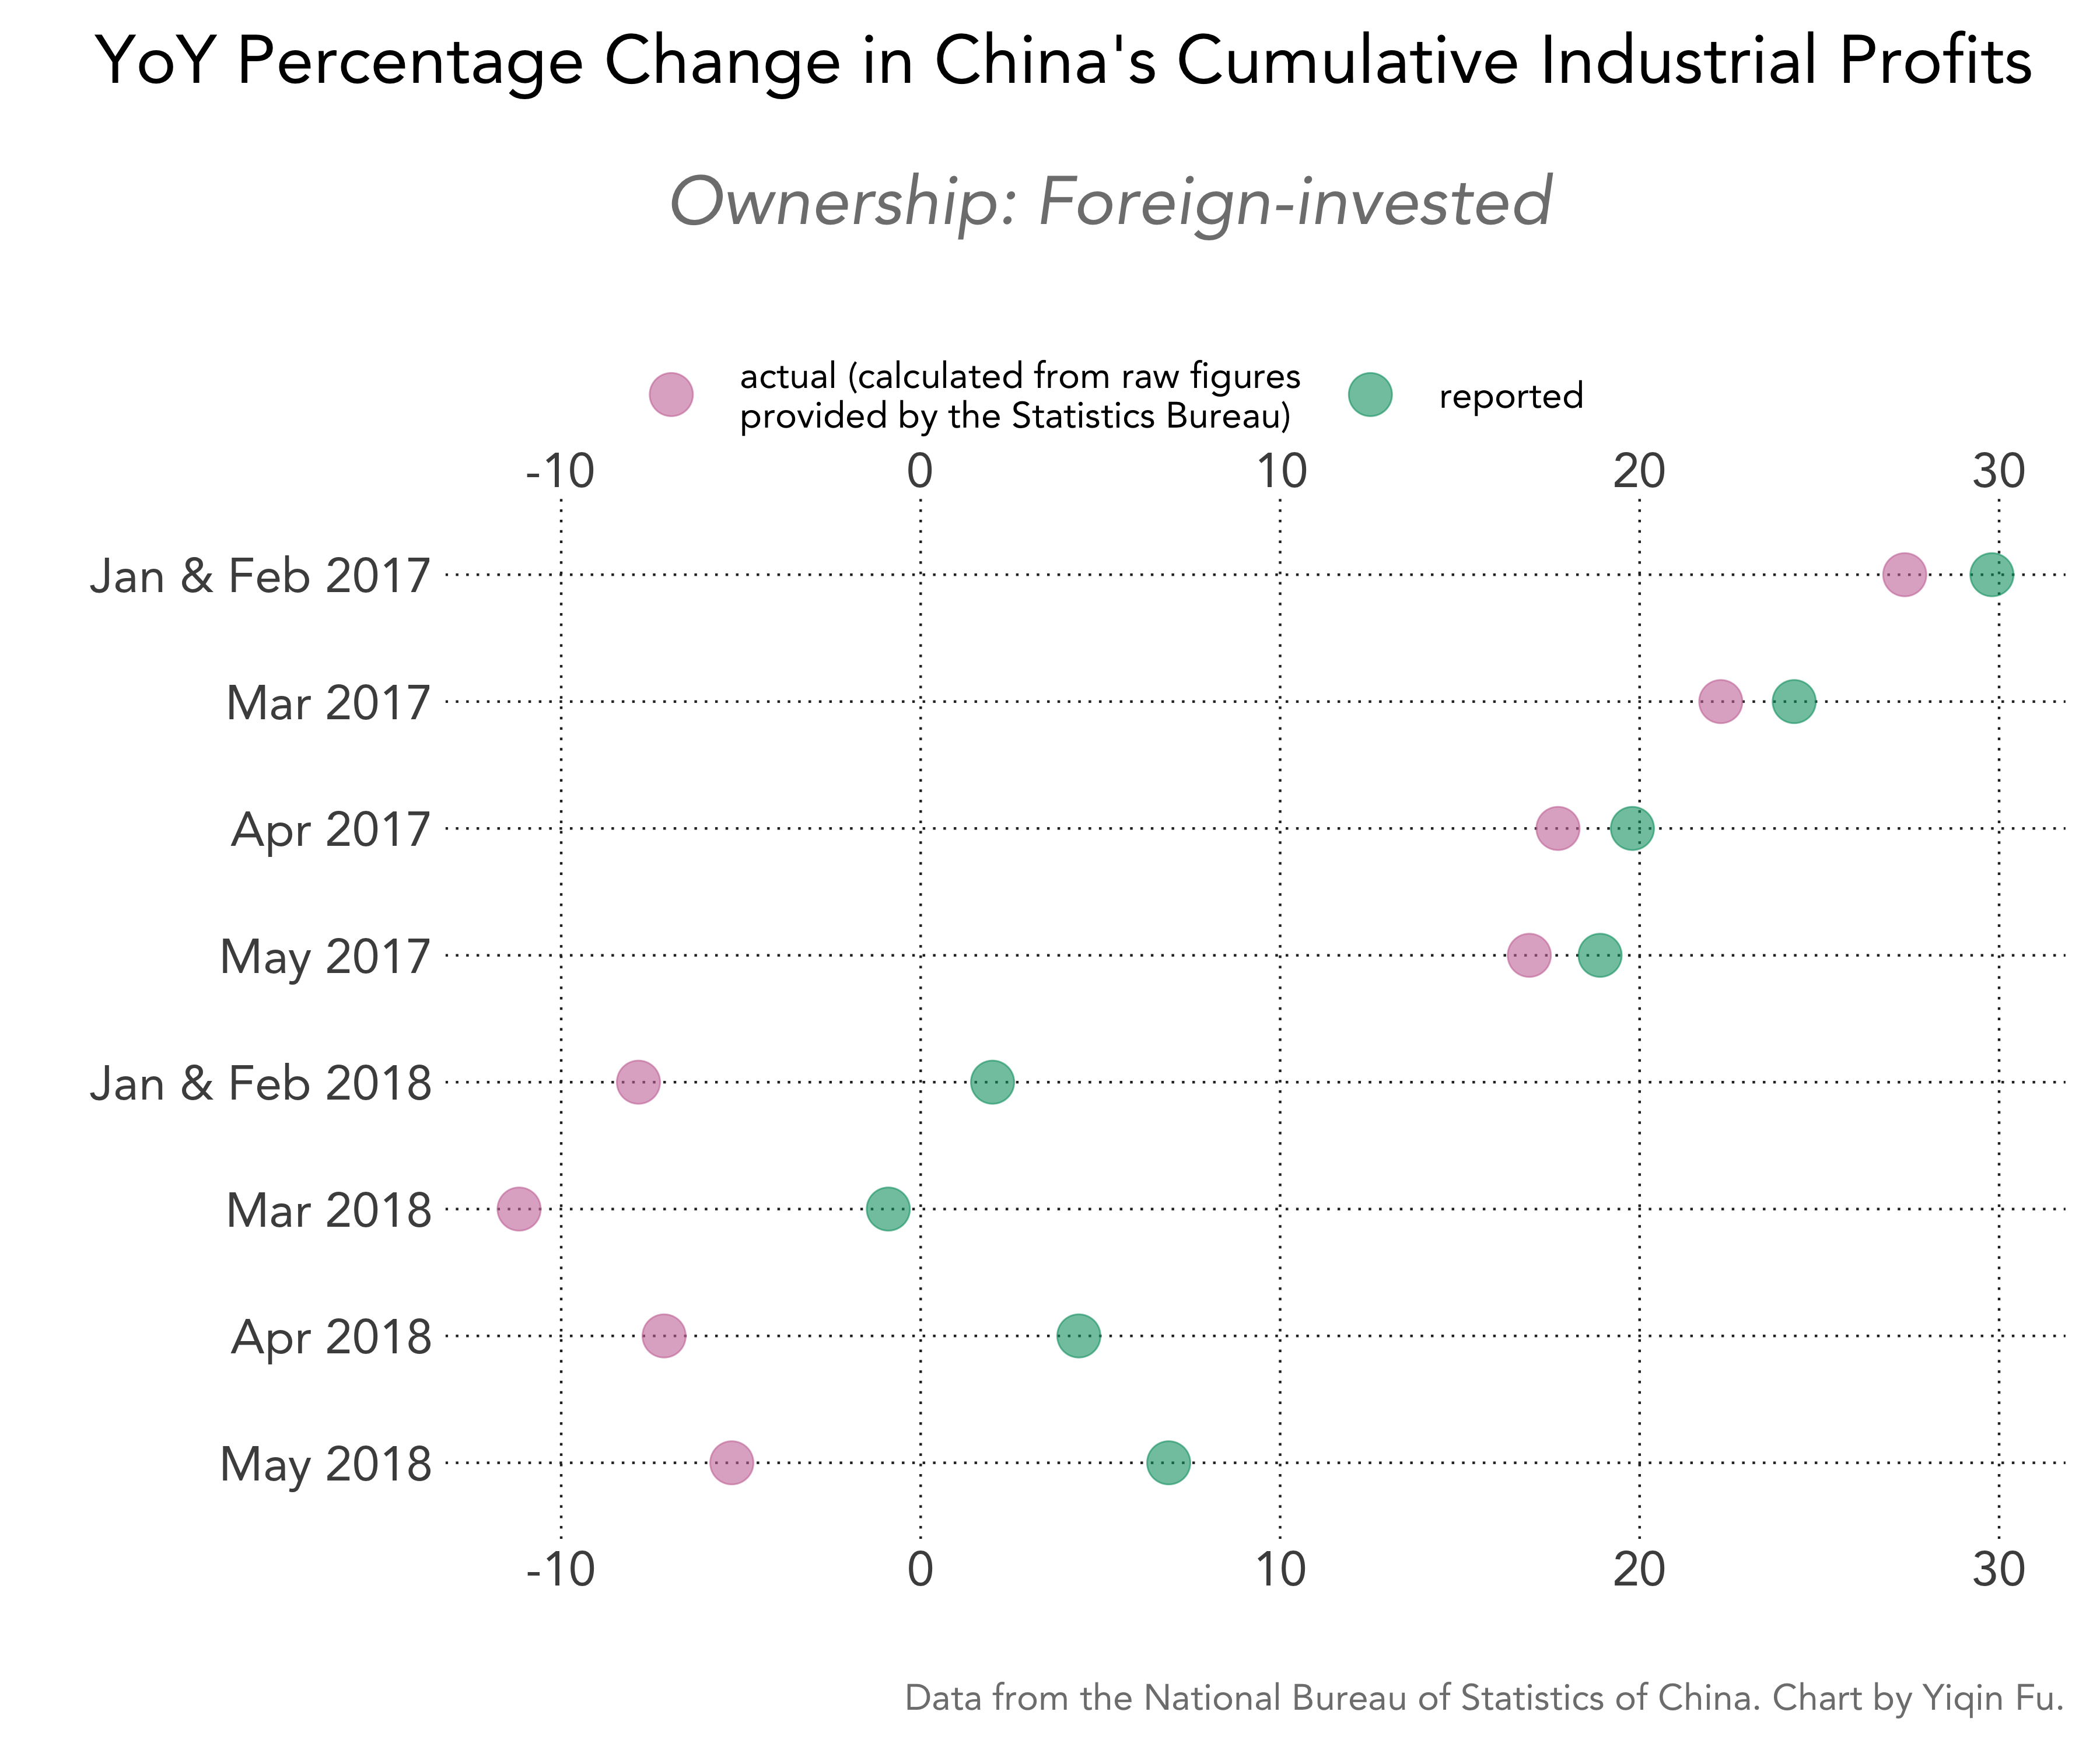
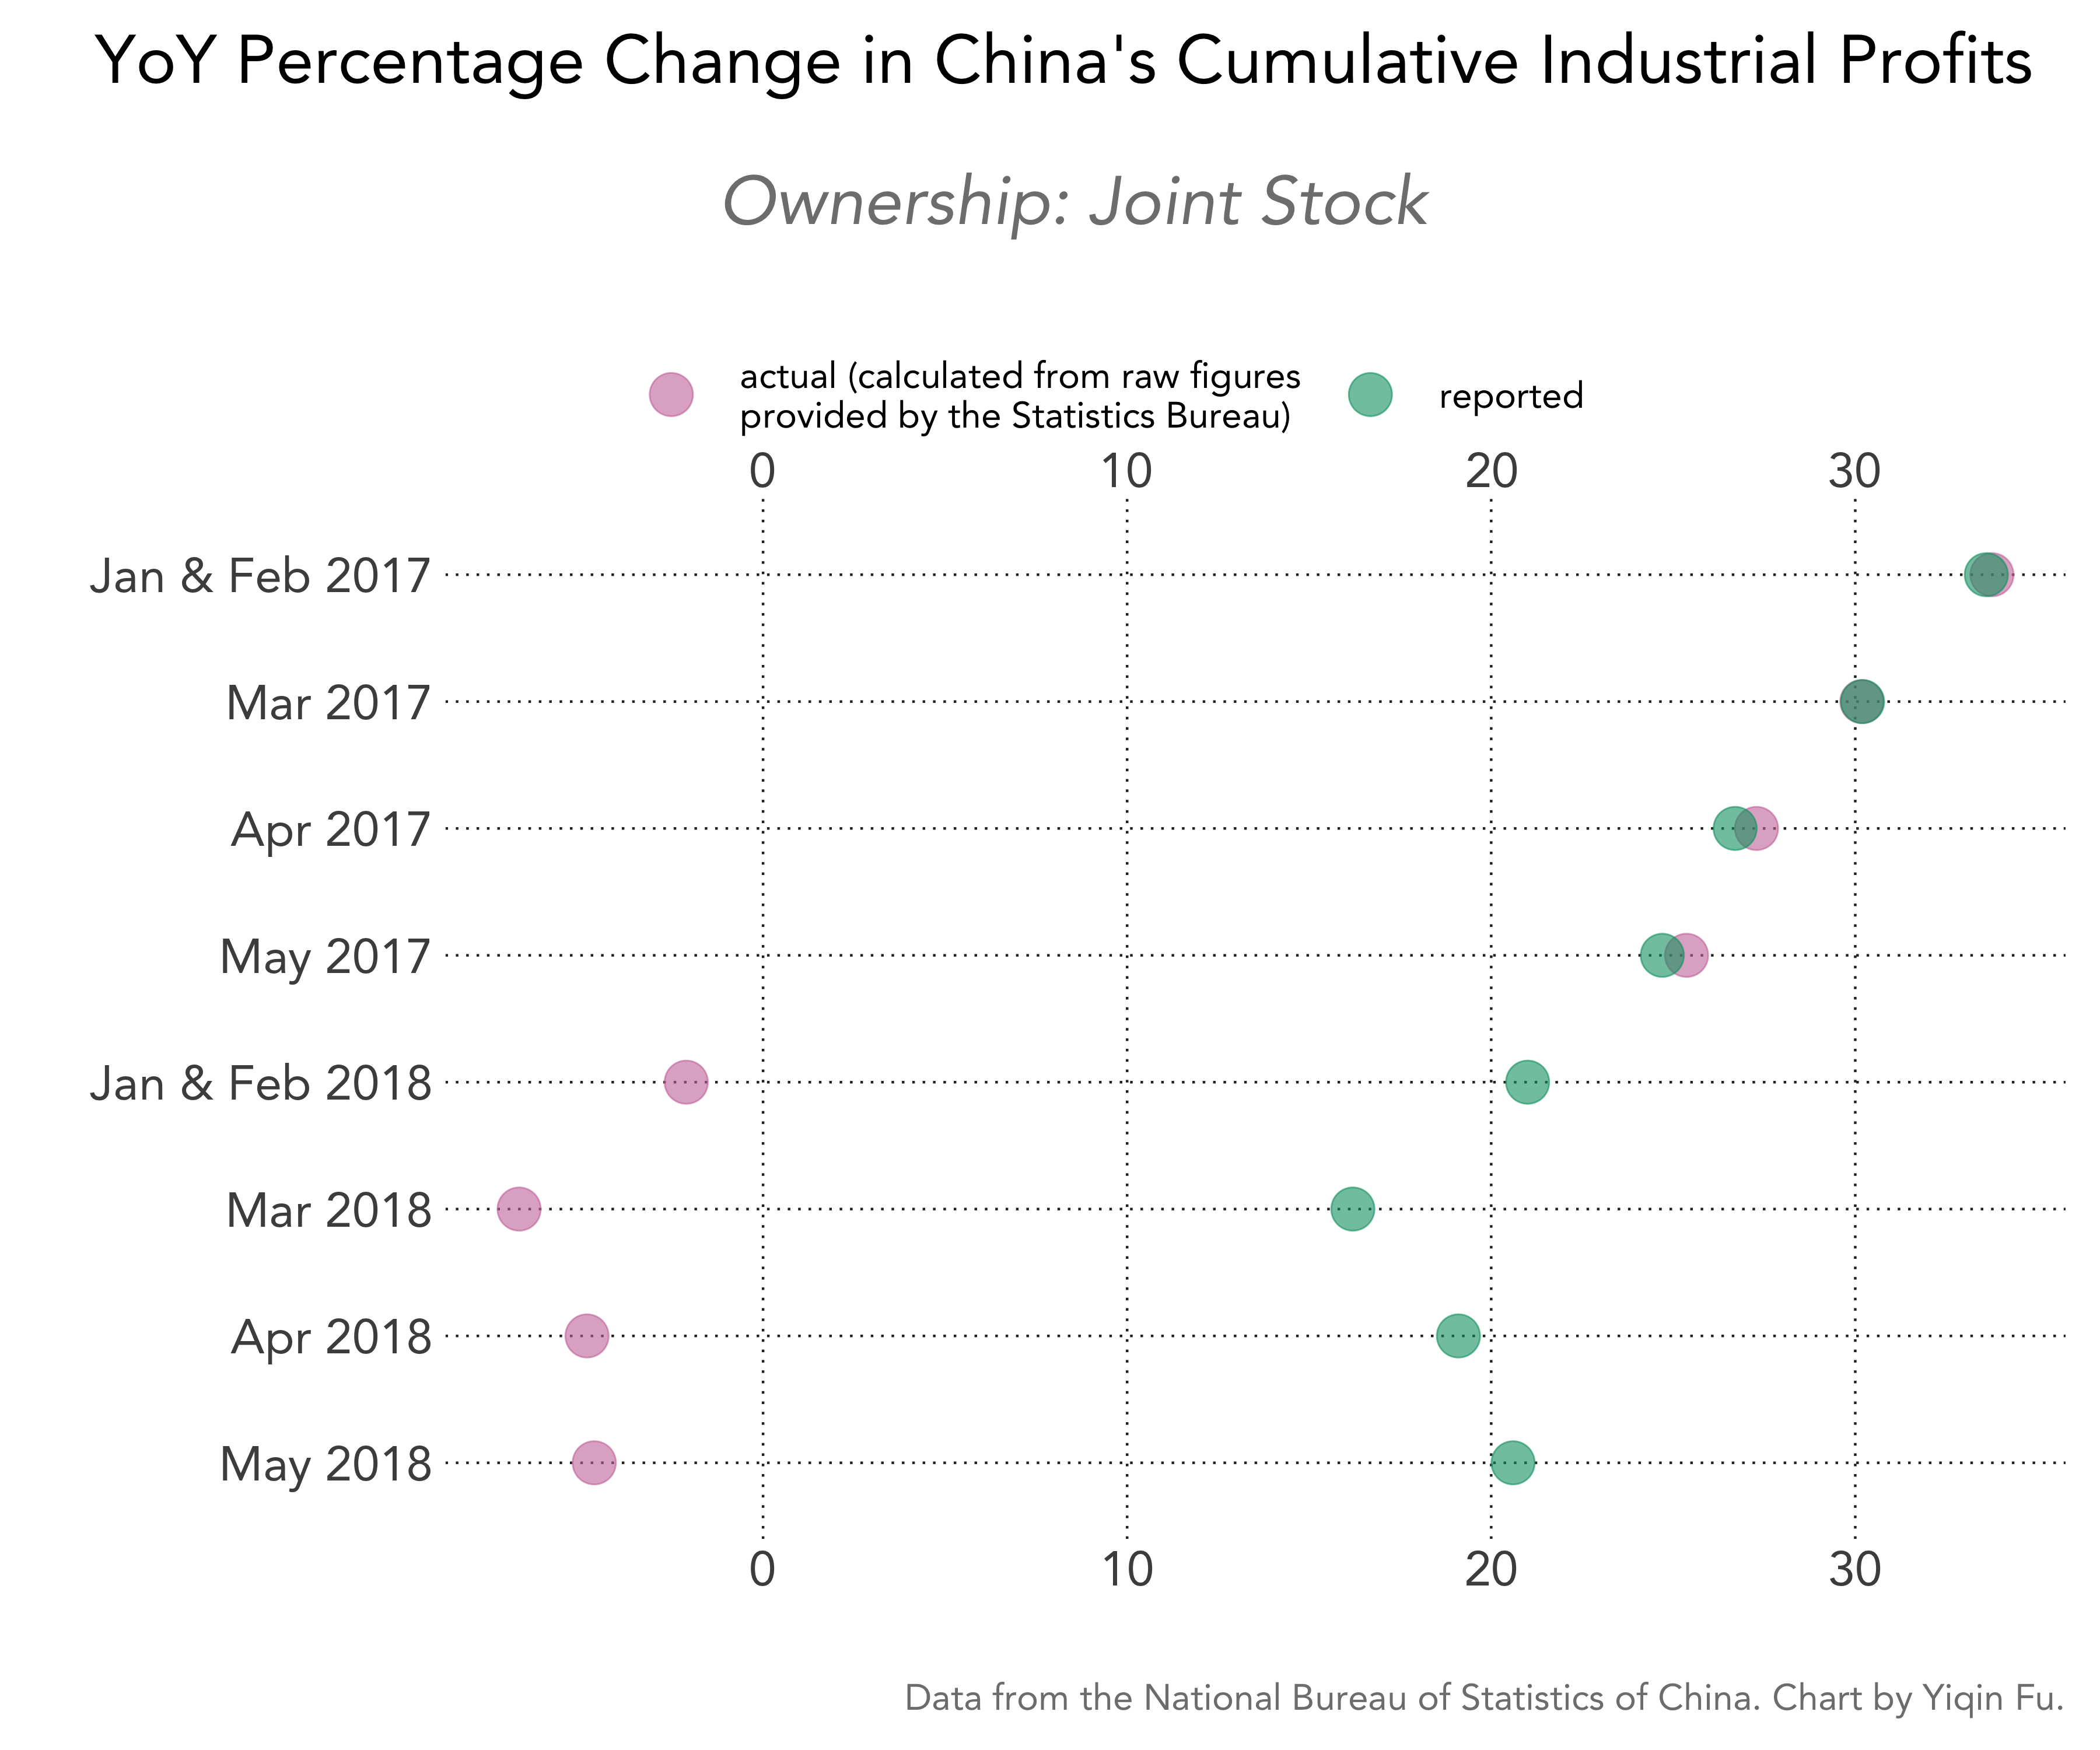
I pulled monthly profit figures from all of the NBS' press releases since 2015 and calculated the year-on-year percentage change using the raw figures. Below is my calculation, which I call “actual growth,” and the growth rate reported by the NBS.
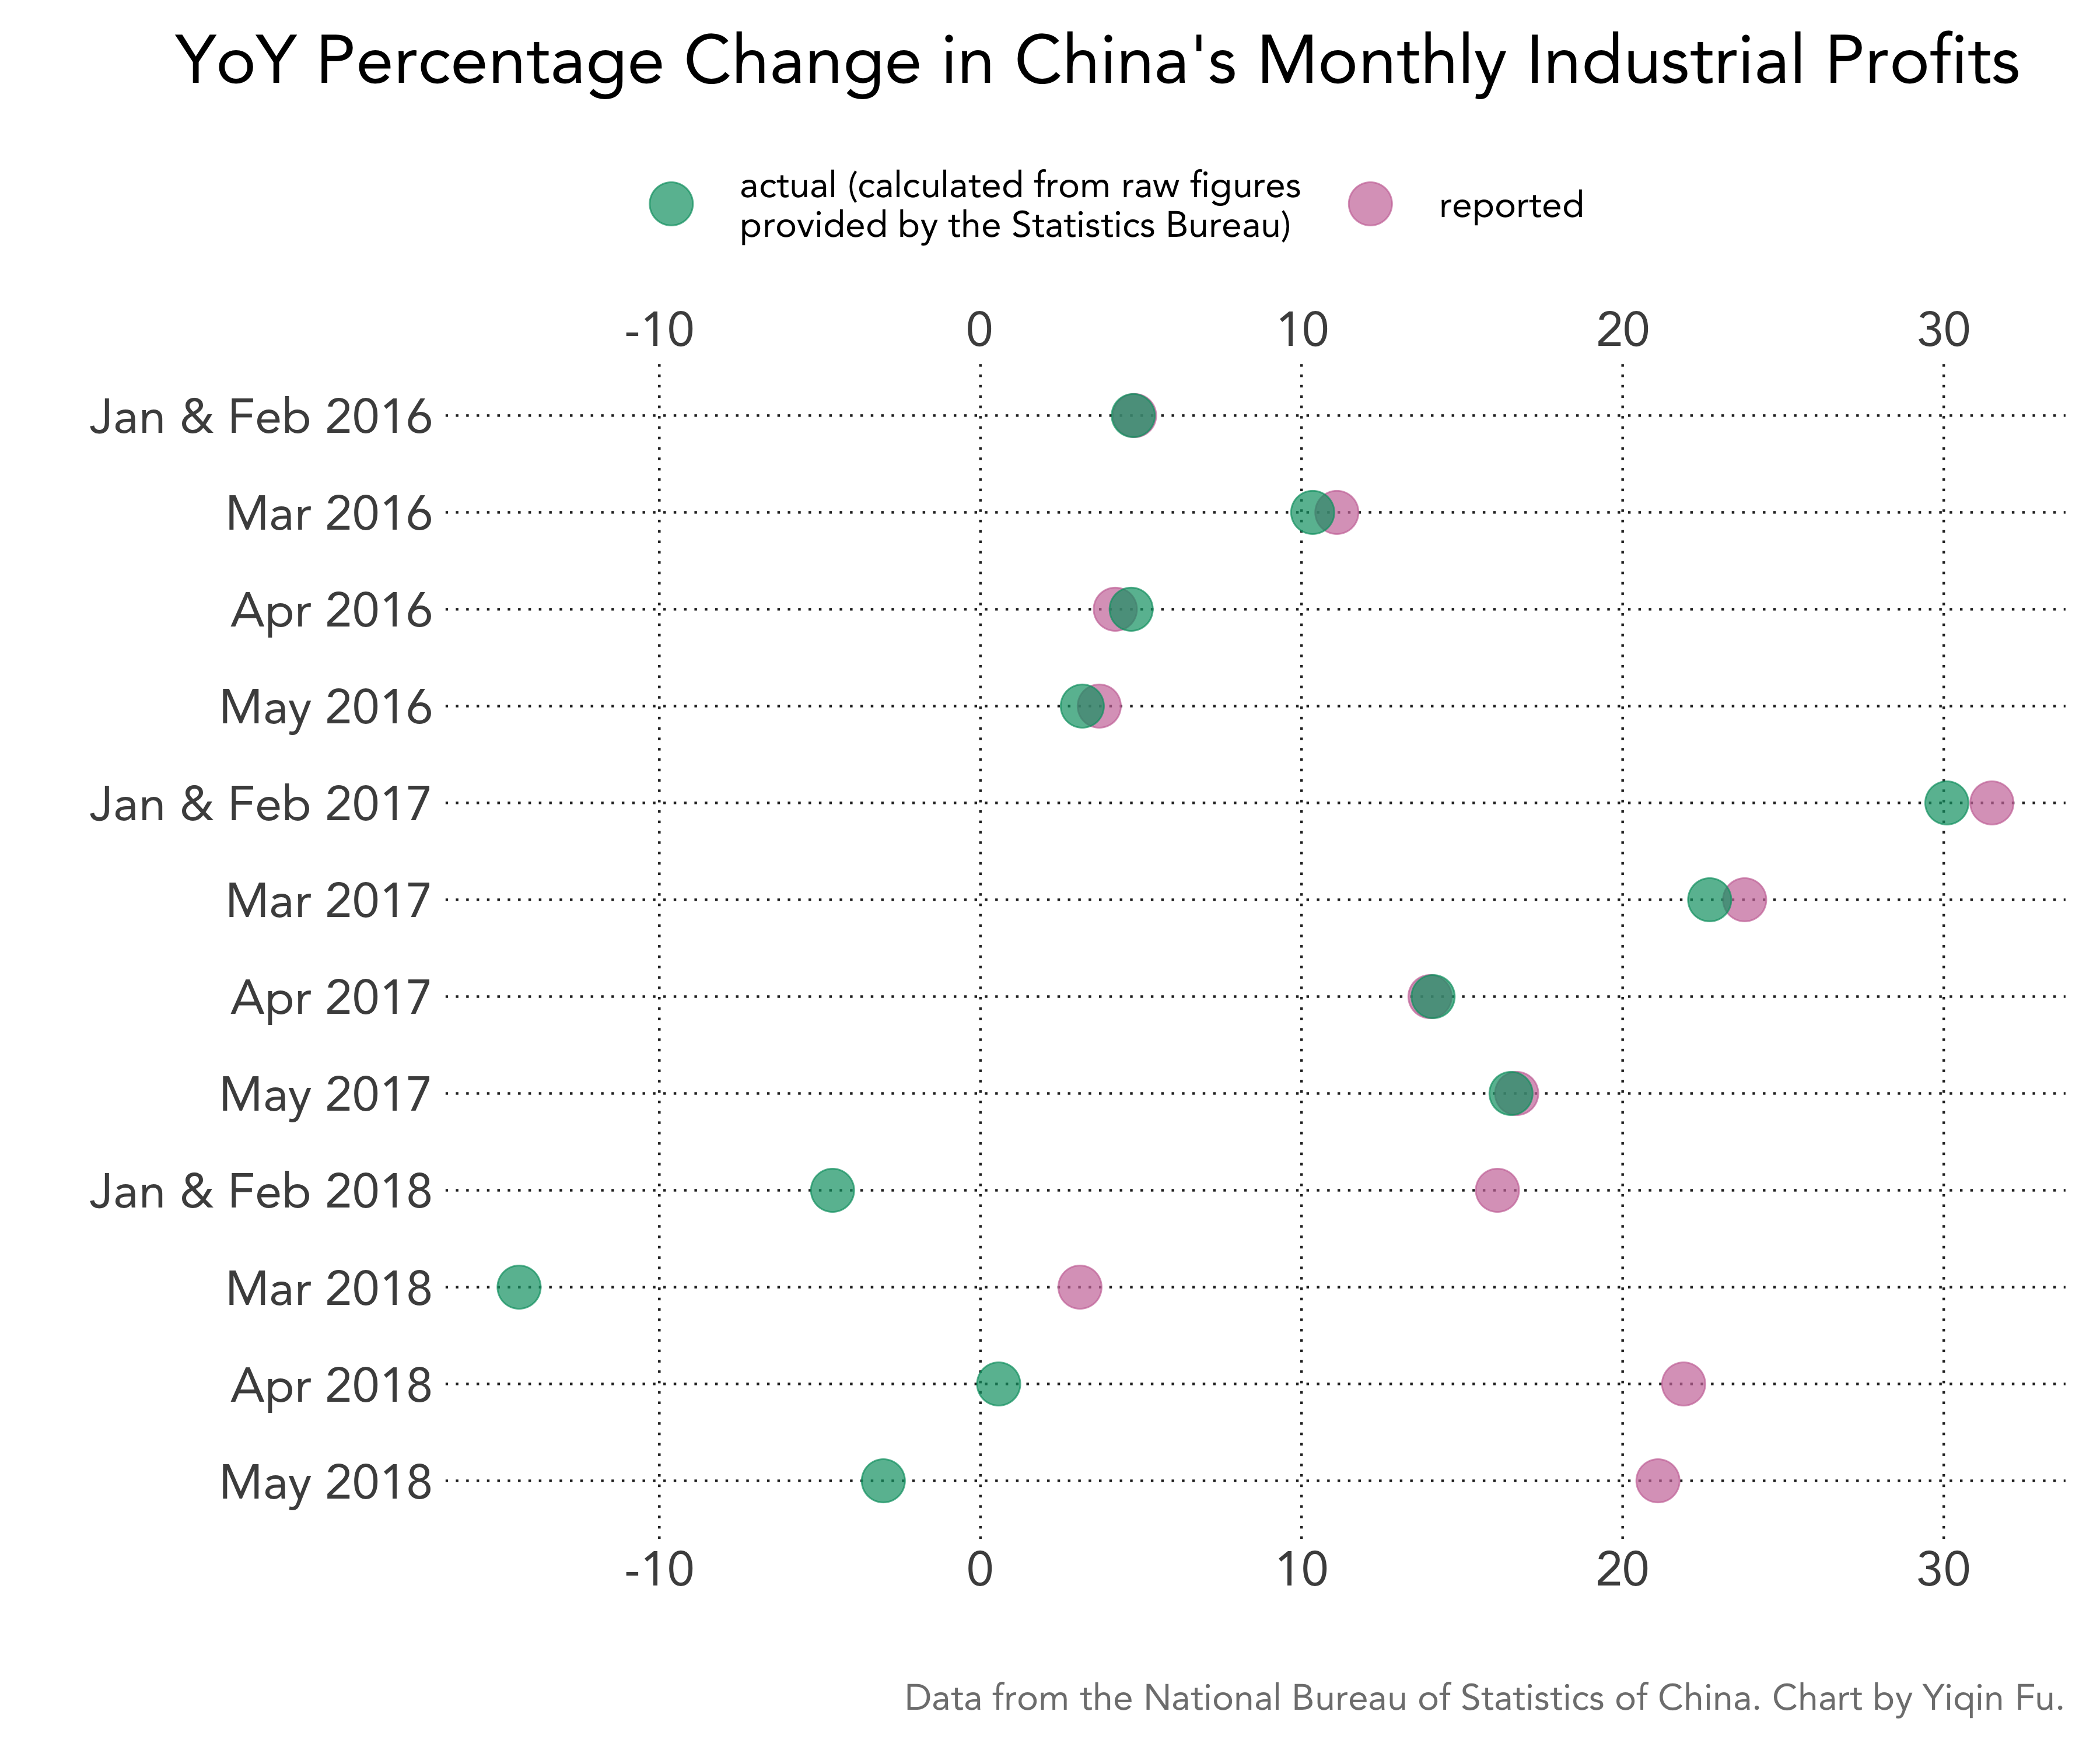
It is evident that before this year, the actual growth rate calculated from raw figures is almost identical to the reported growth rate. Only starting this year did the discrepancy appear.
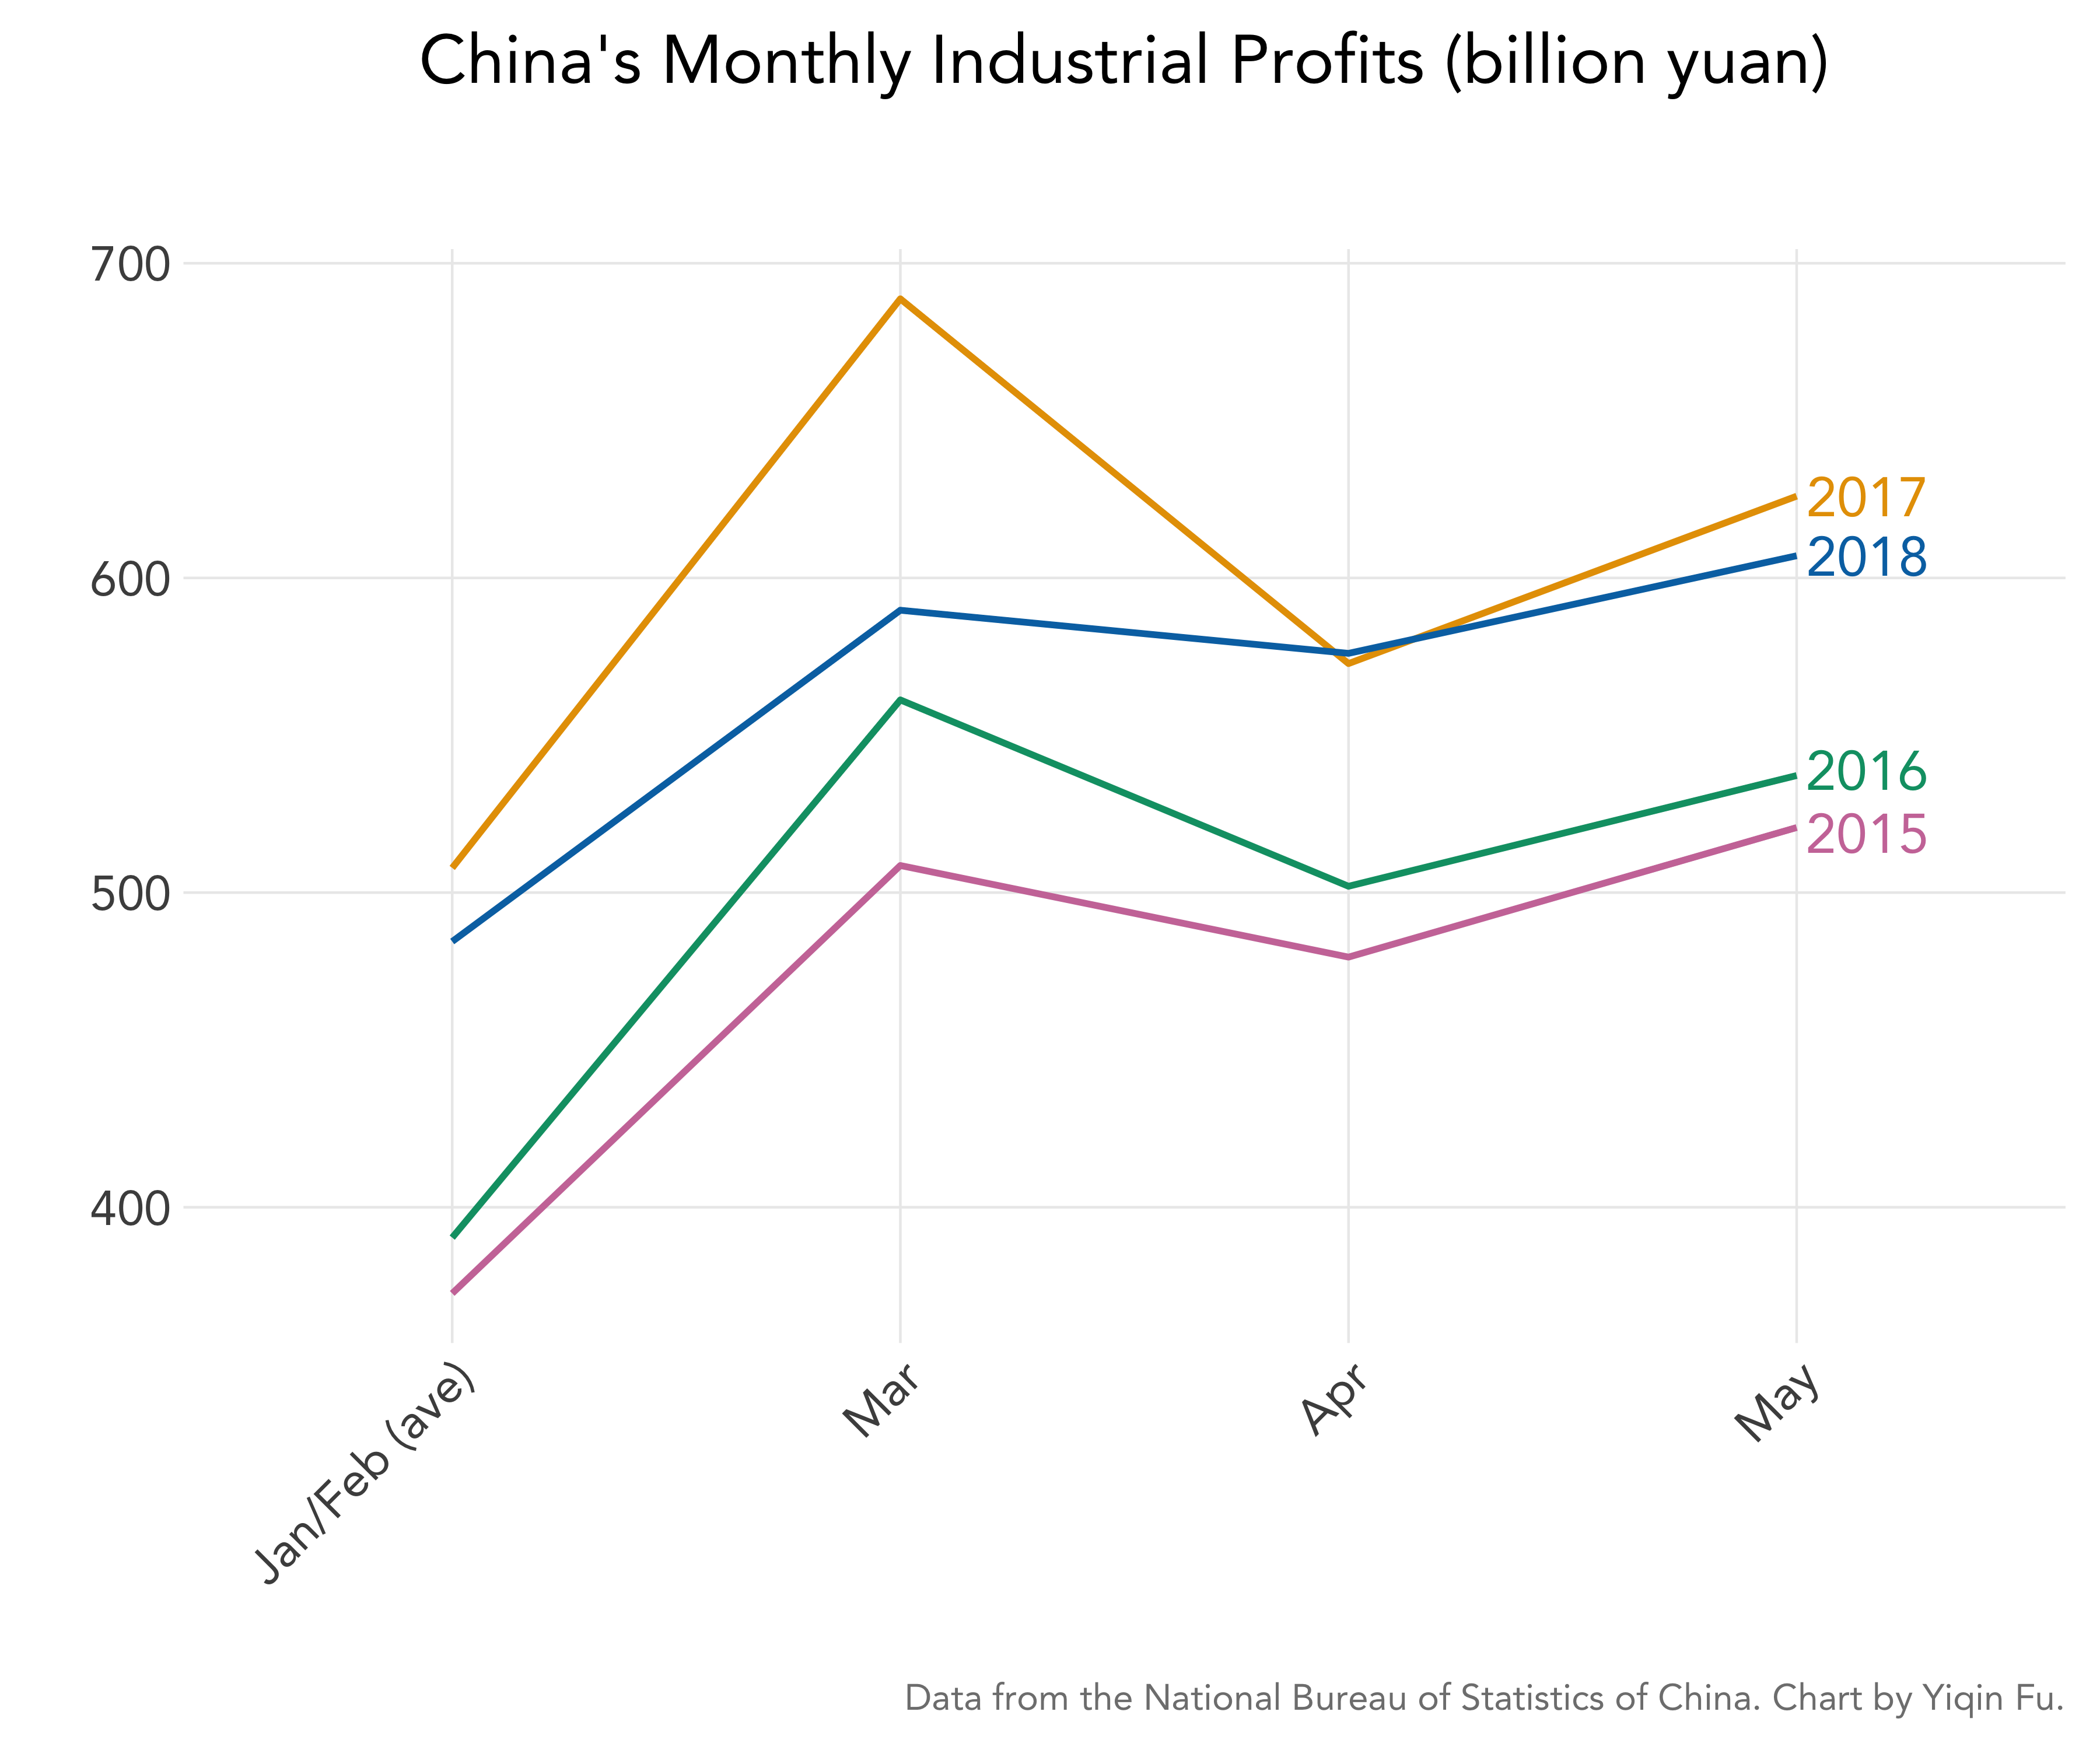
I am not going to speculate why. But here is the monthly industrial profit in billion yuan for the months of January through May, from 2015 to 2018.
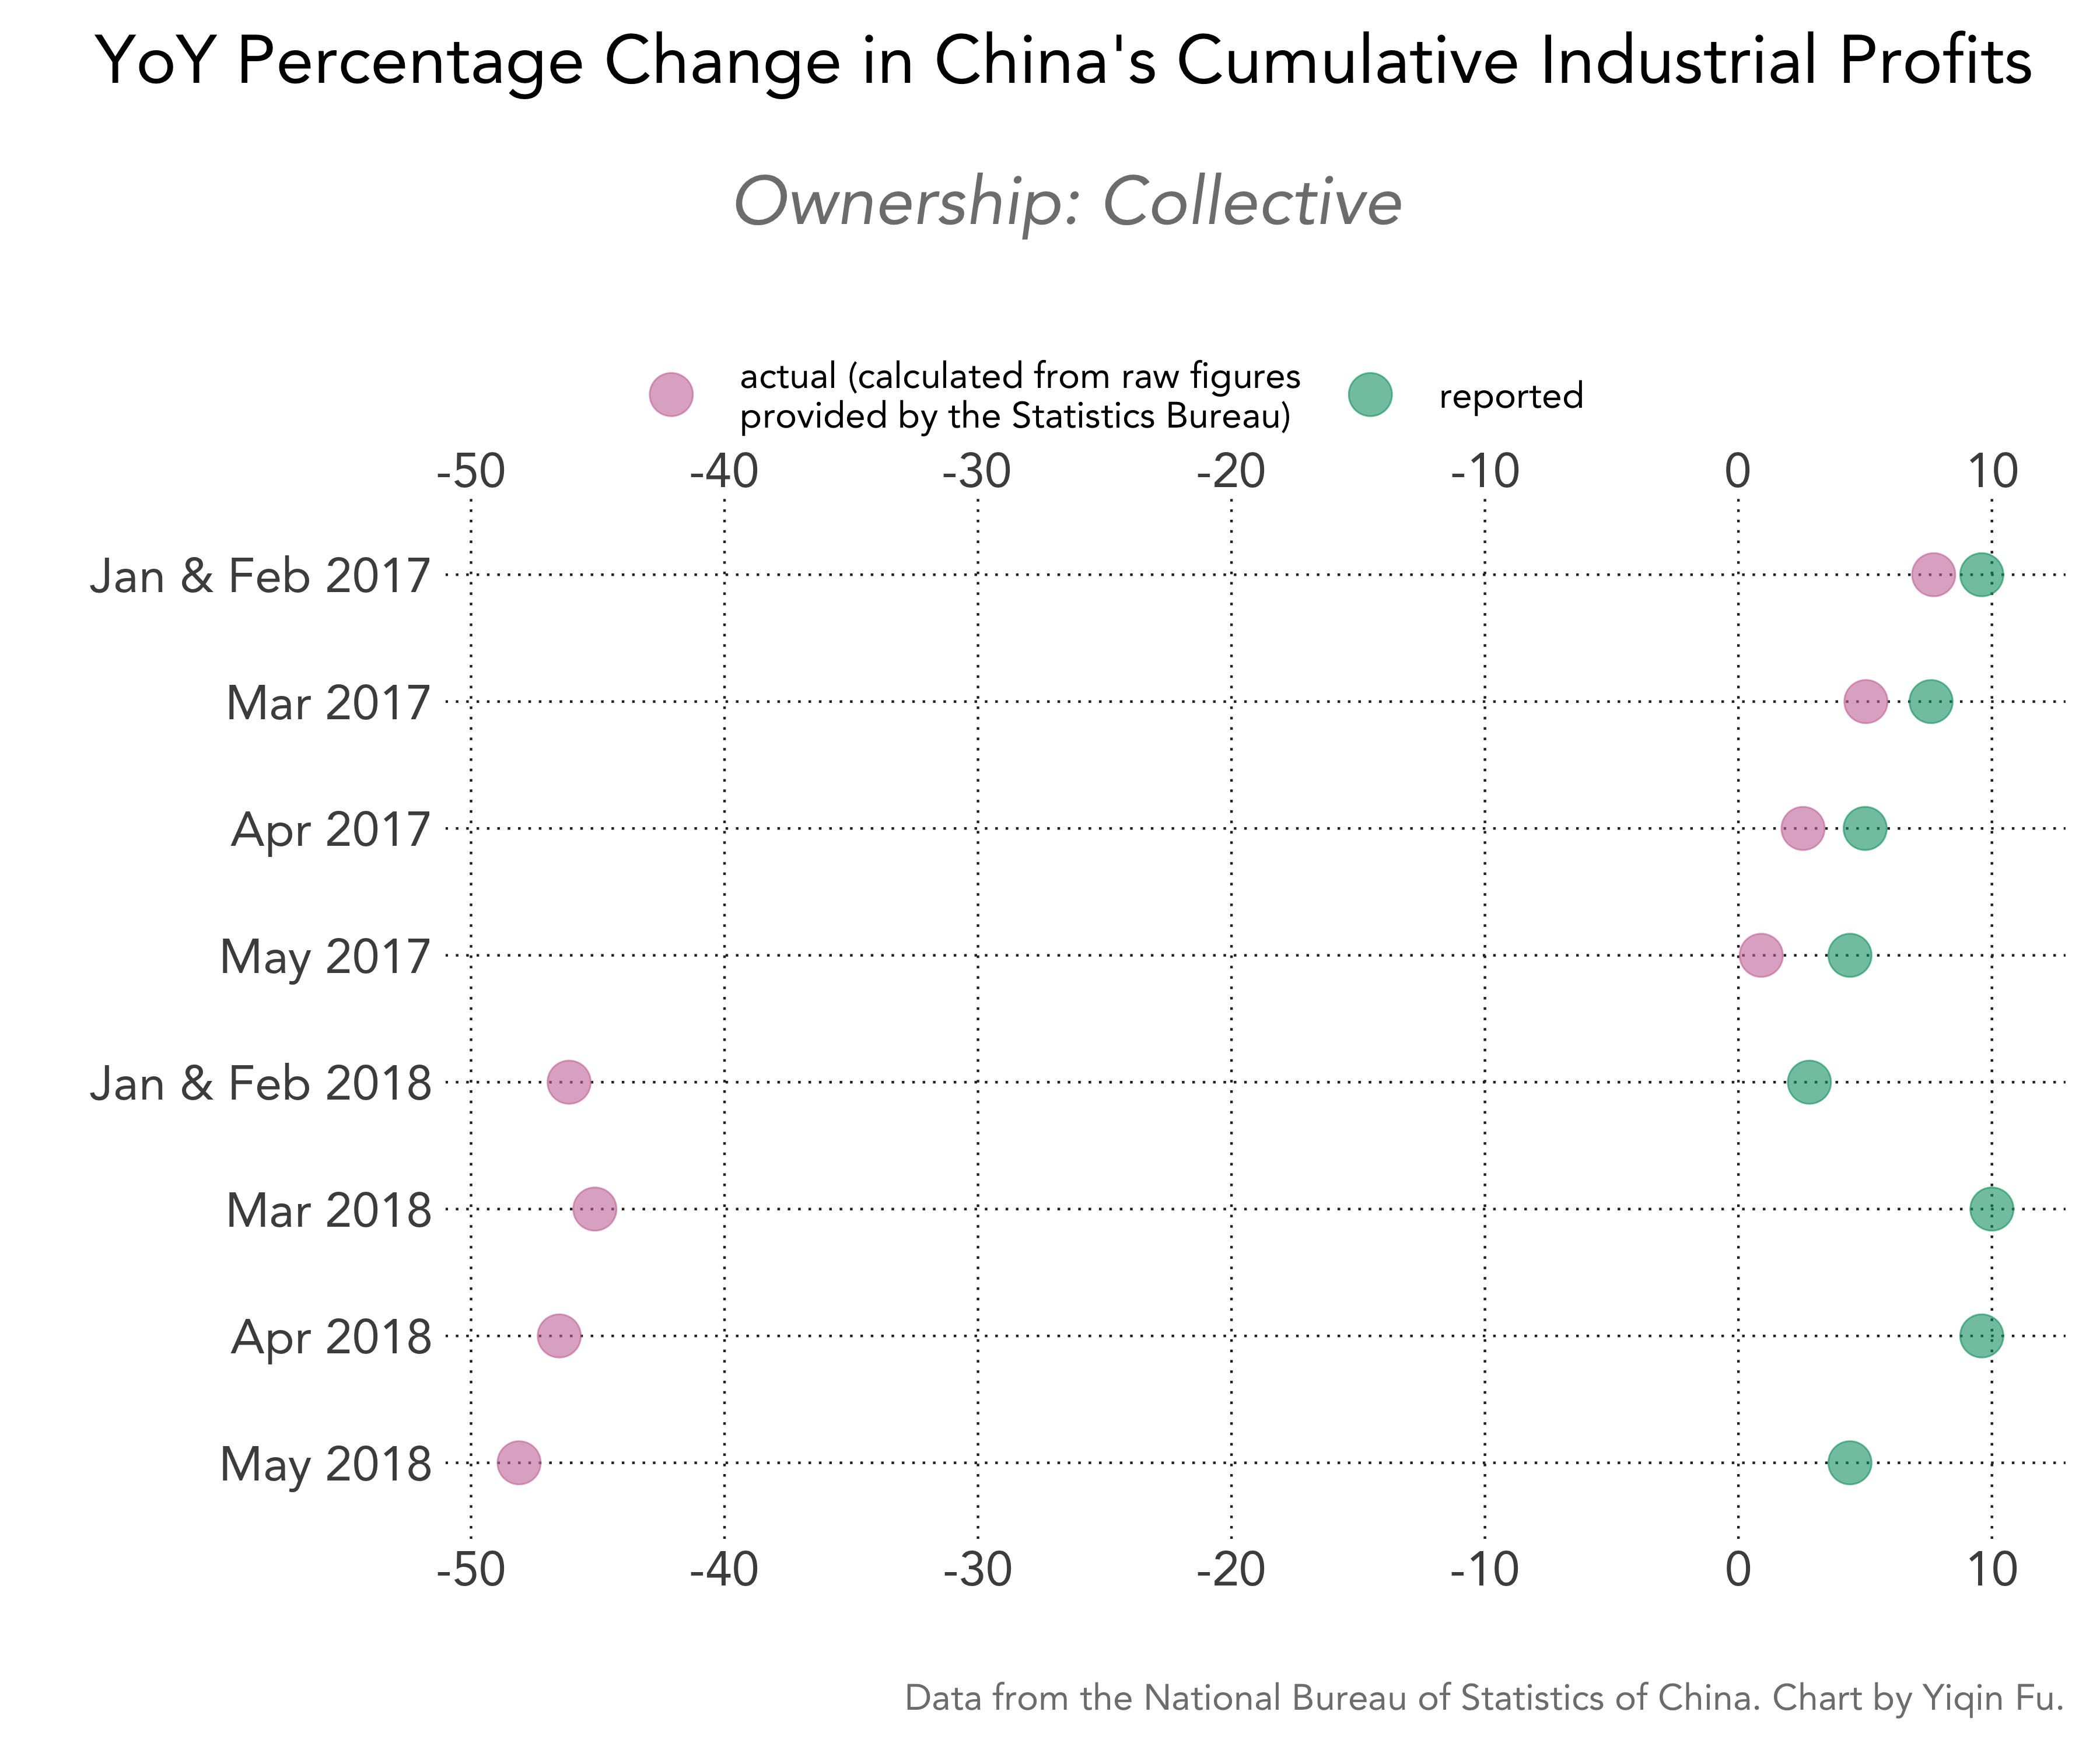
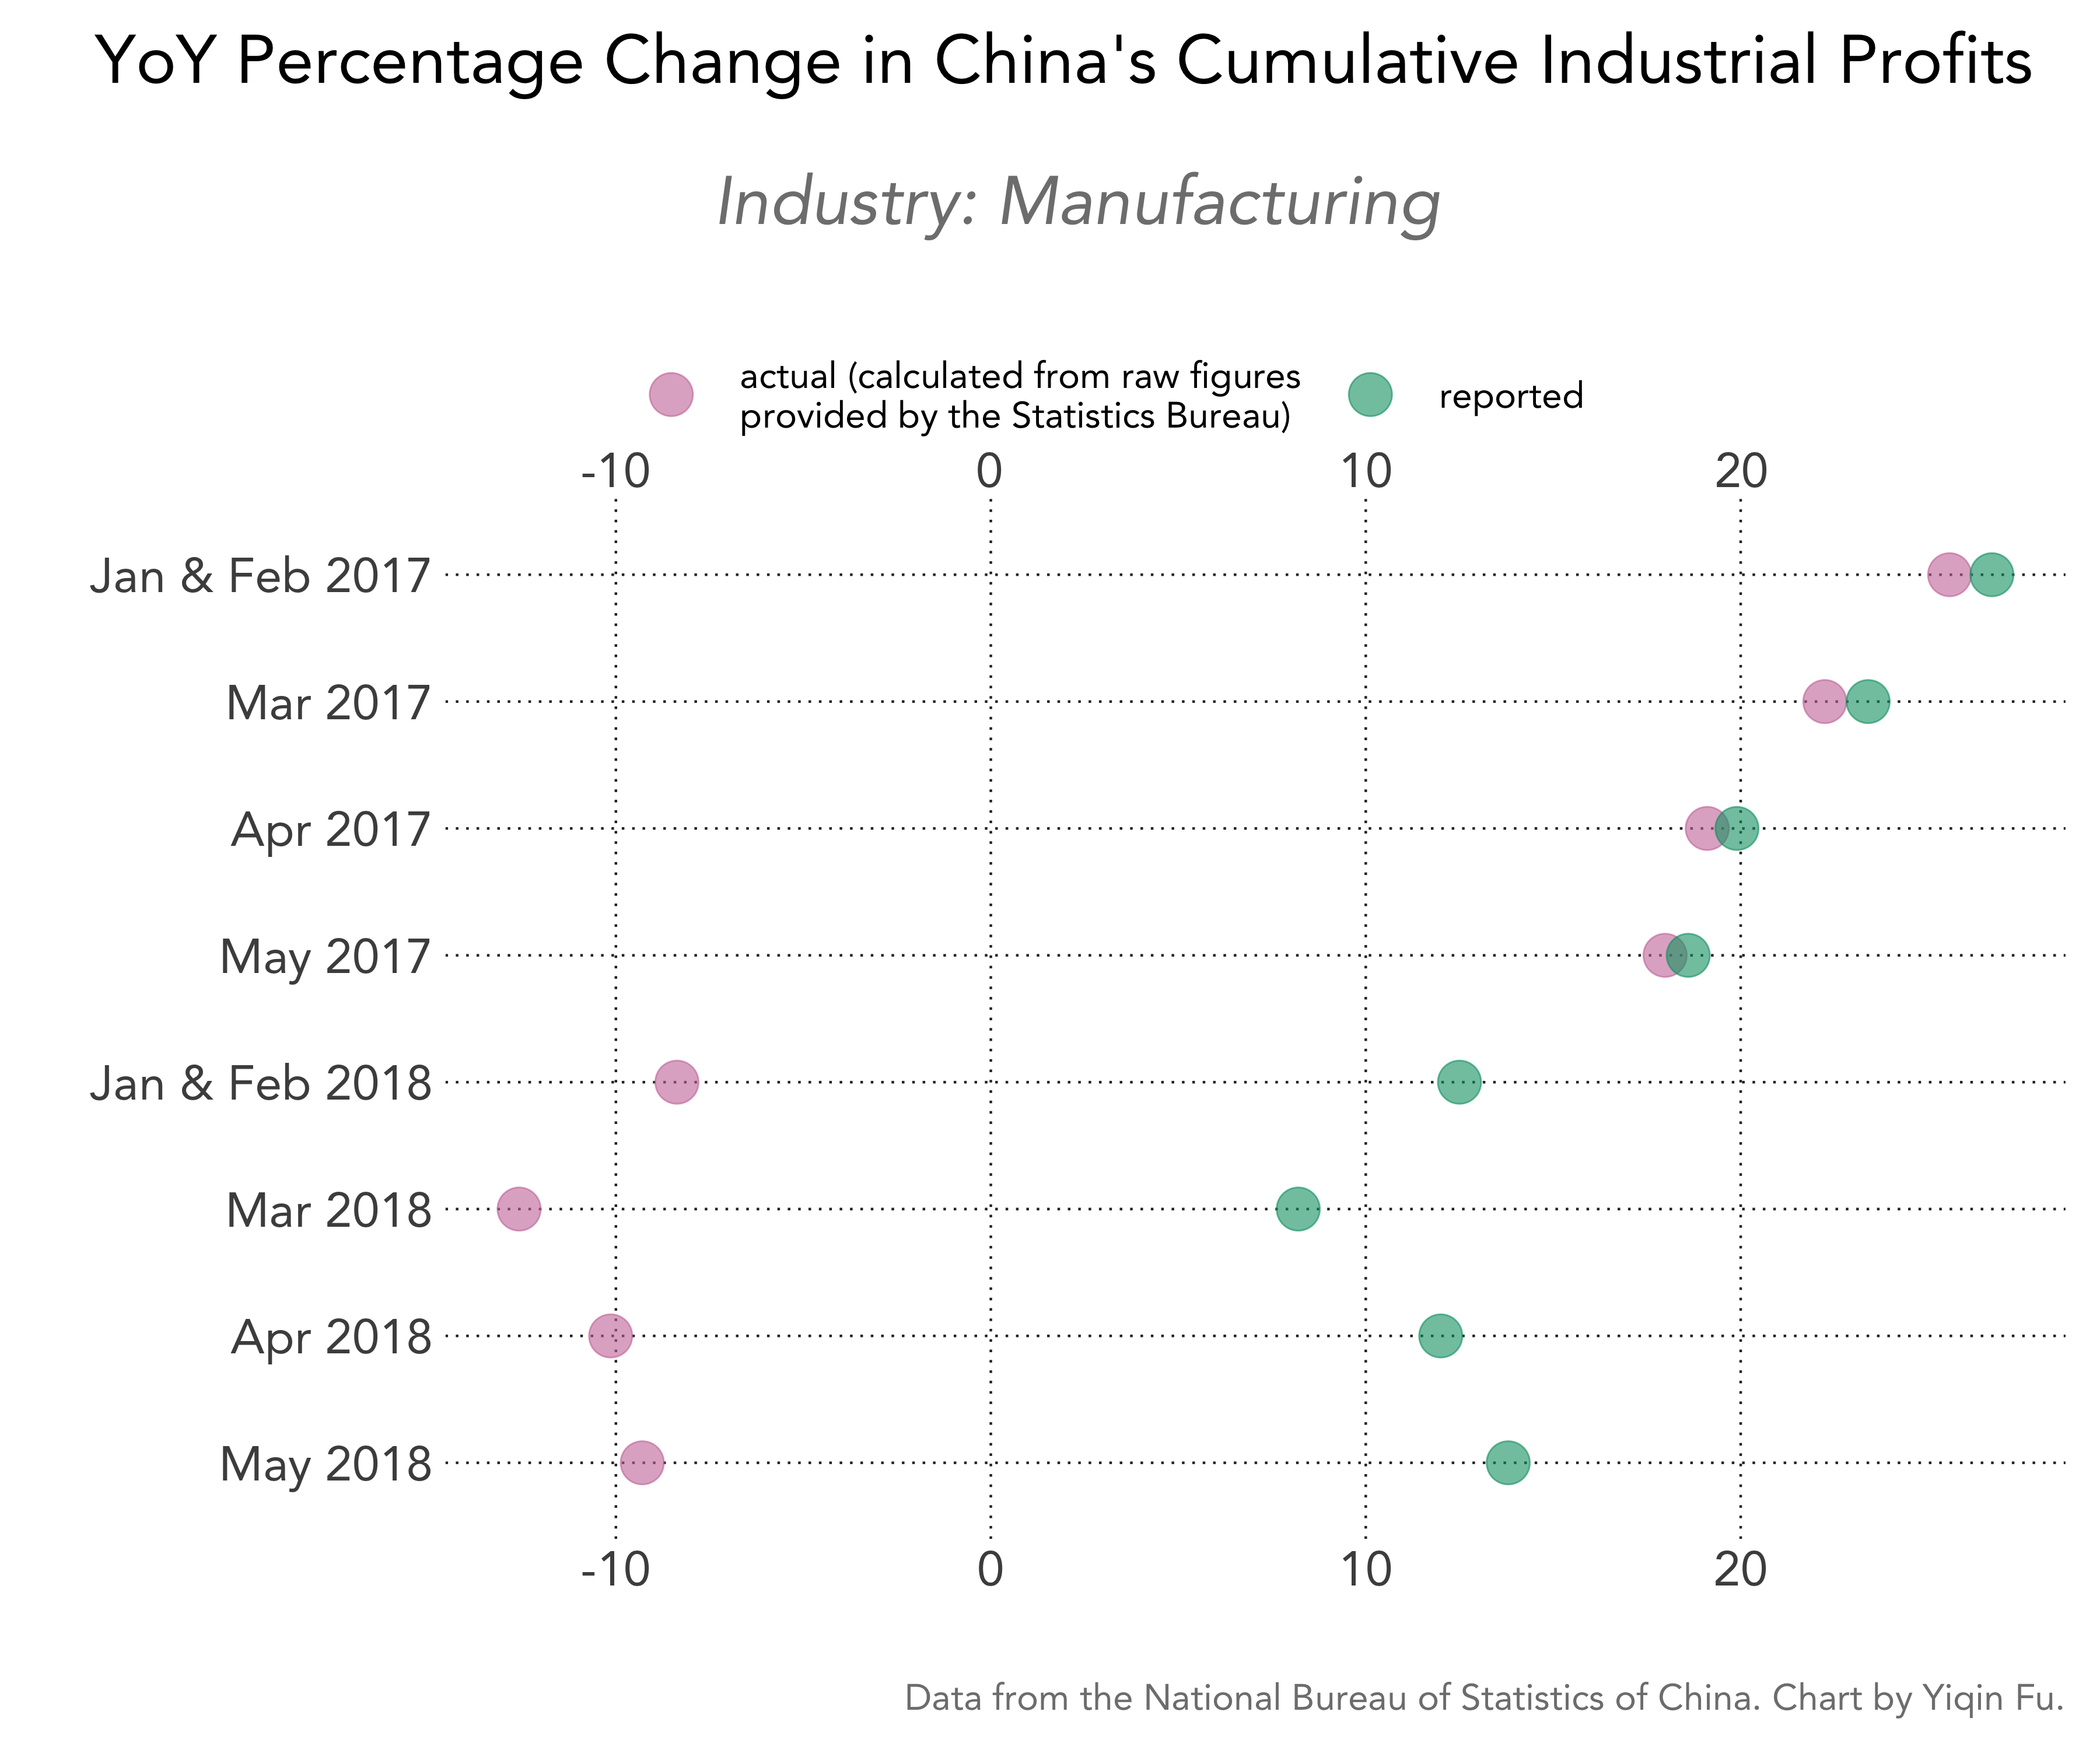
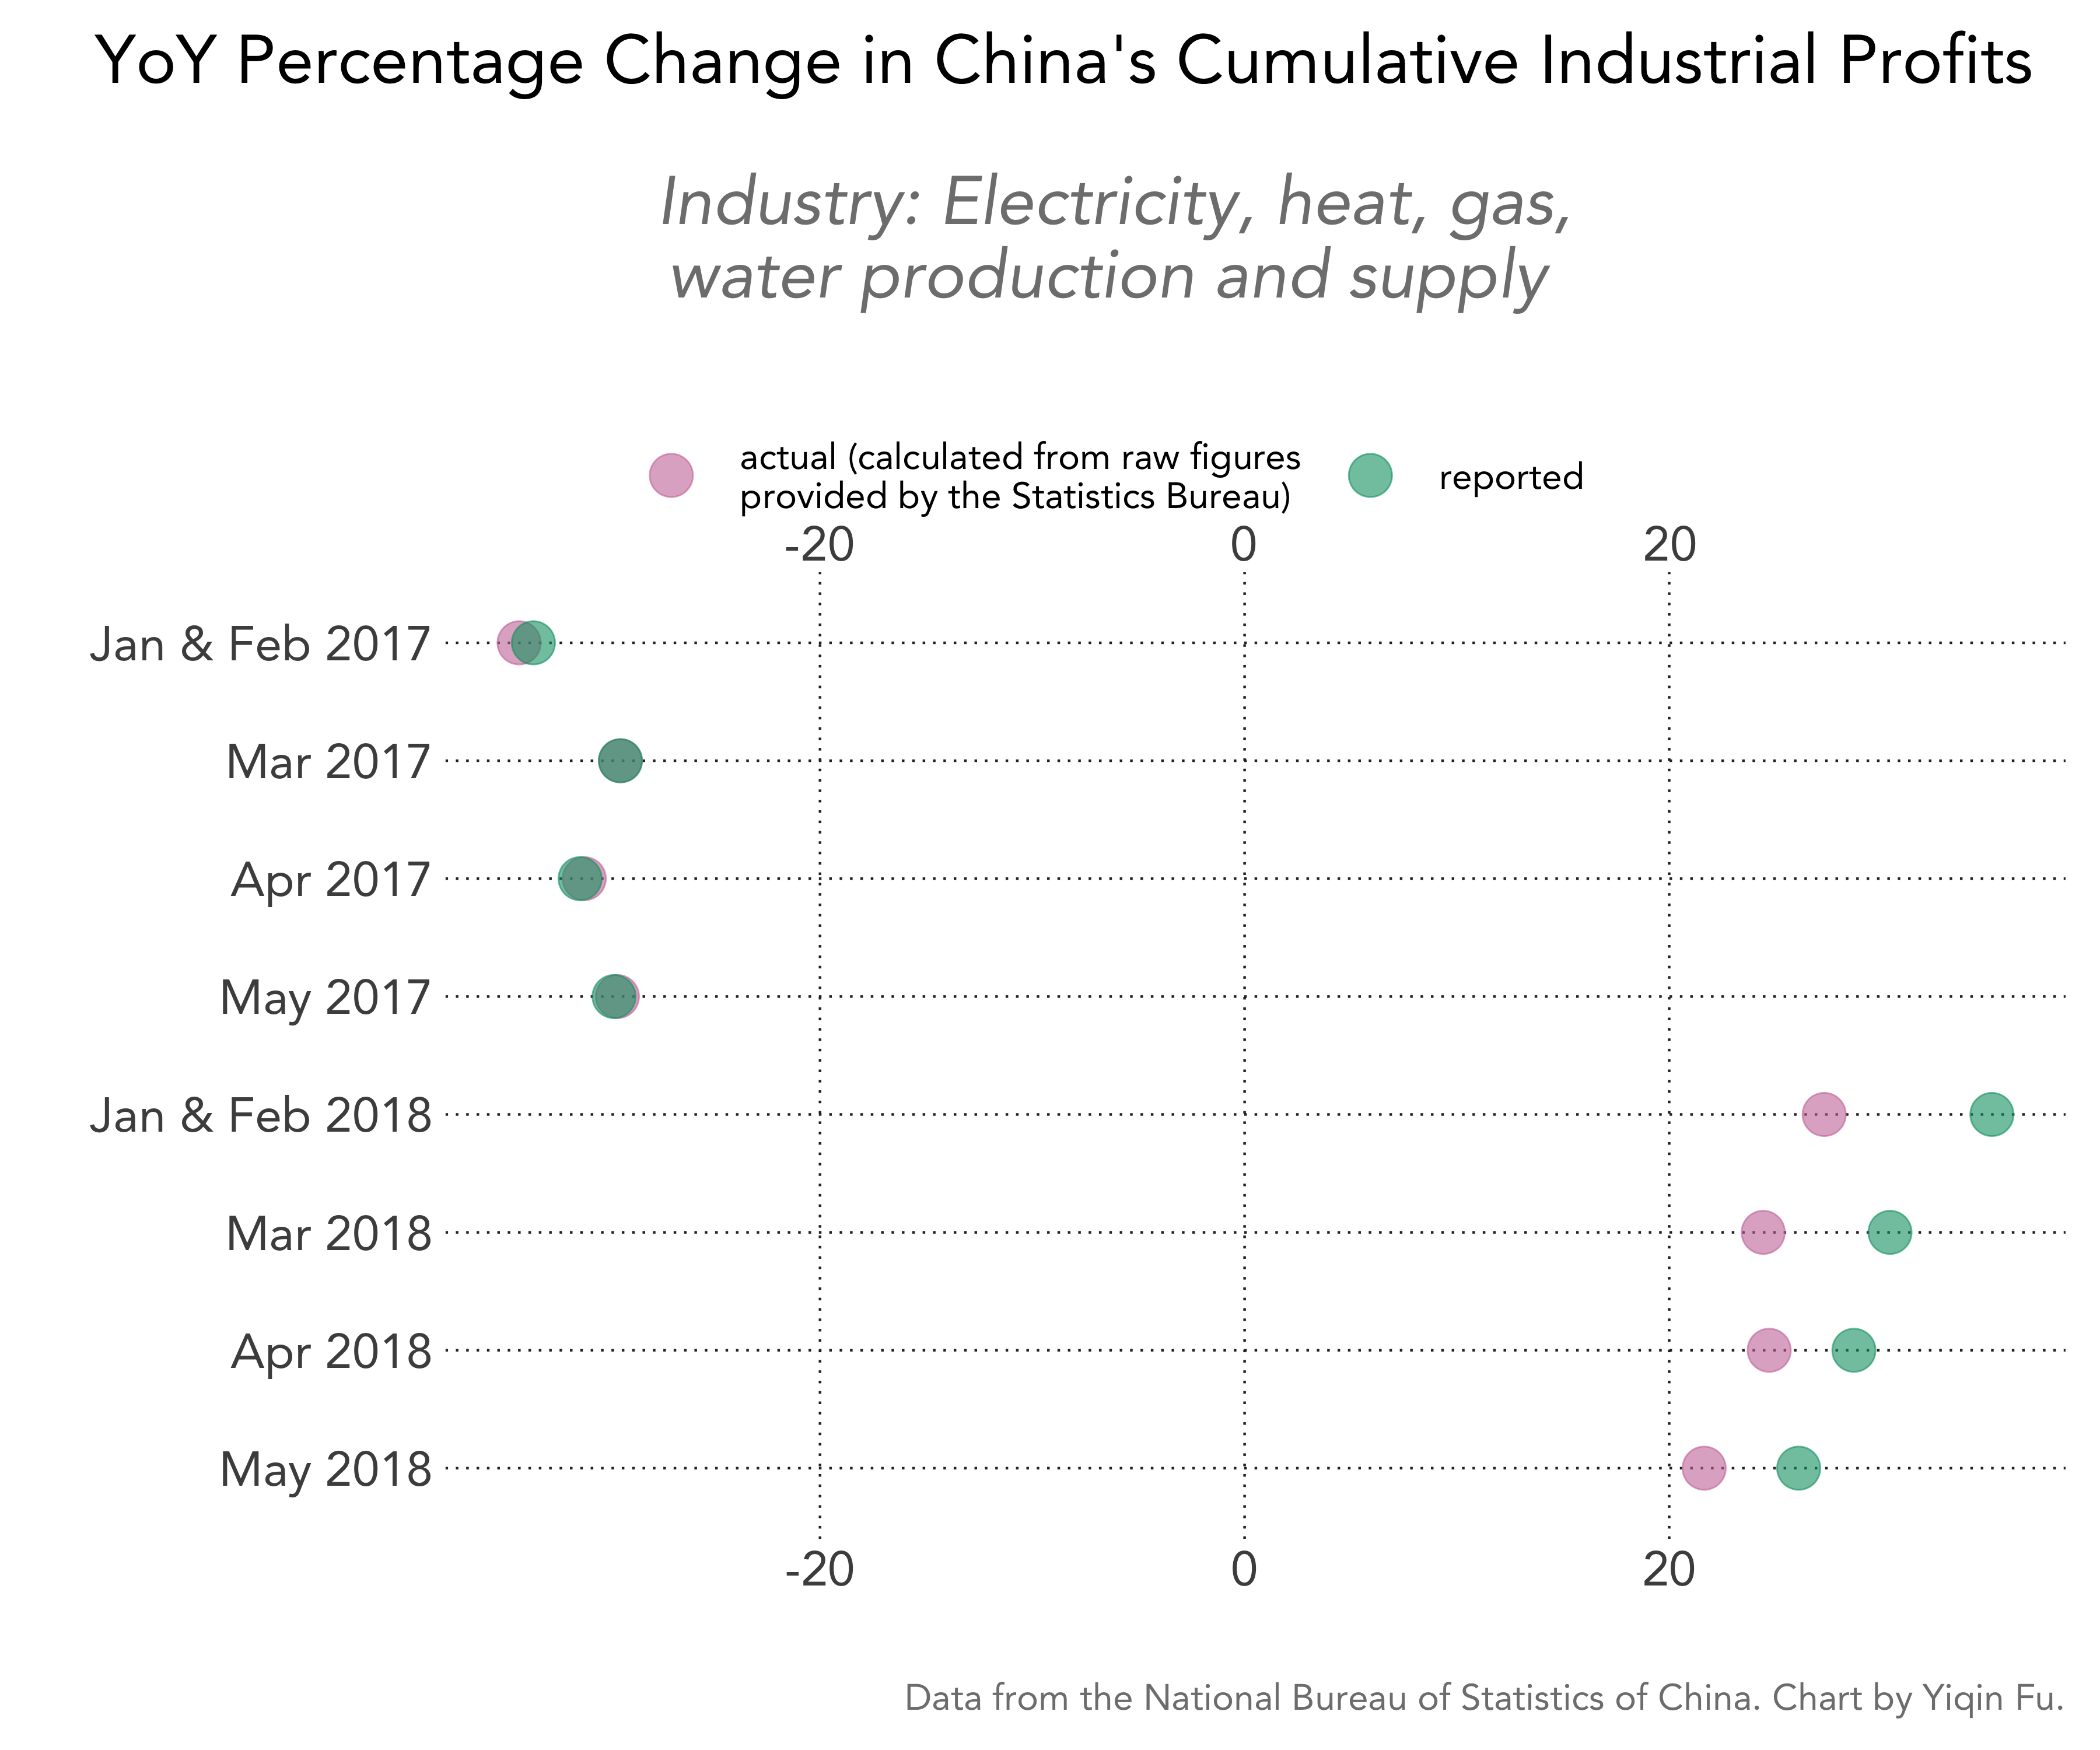
The NBS press releases also report raw numbers on subcategories as well, e.g. by industry and by ownership (SOE, etc.). Below are the actual vs. reported growth rate for all subcategories. The mining industry has some missing data and is thus not plotted below.
