Comparing E-Commerce's Footprint in China, the U.S., and the U.K.
Aug 19, 2021 · 723 words · 4-minute read
August 2021 Update: I wrote the following post in November 2018 but updated all charts to reflect the latest available data.
China’s Black Friday, known in the country as “Single’s Day,” falls on the 11th of November each year. It was started in 2009 by the e-commerce giant Alibaba, from which Chinese consumers bought more than $25 billion worth of goods last year on a single day.
As the world’s the largest shopping day approaches, I thought it would be interesting to compare the share of online sales as a percentage of total sales across different countries. E-commerce is often thought to play an oversized role in China compared to developed countries – is that true?
My biggest takeaway from this research is that online sales data should be treated with caution, especially when making cross-country comparisons. The definitions, sampling methodology, data quality, etc. all vary, so it is impossible to conduct a reliable cross-country analysis. For example, some countries define “e-commerce sales” as “physical goods sold via the Internet” (thus excluding virtual goods); others use the definition “goods sold online by brick-and-mortar stores” (thus excluding online-only stores).
Besides the differences in definition, sampling also raises a major issue. The online sales data does not come from administrative records. Instead, the statistics bureaus in each country survey a subset of firms and make an estimate. Given that the survey methodology and subsequent analysis are not standardized across countries, it is likely that the large discrepancies in reported figures reflect differences in data collection and analysis methods rather than differences in actual e-commerce sales.
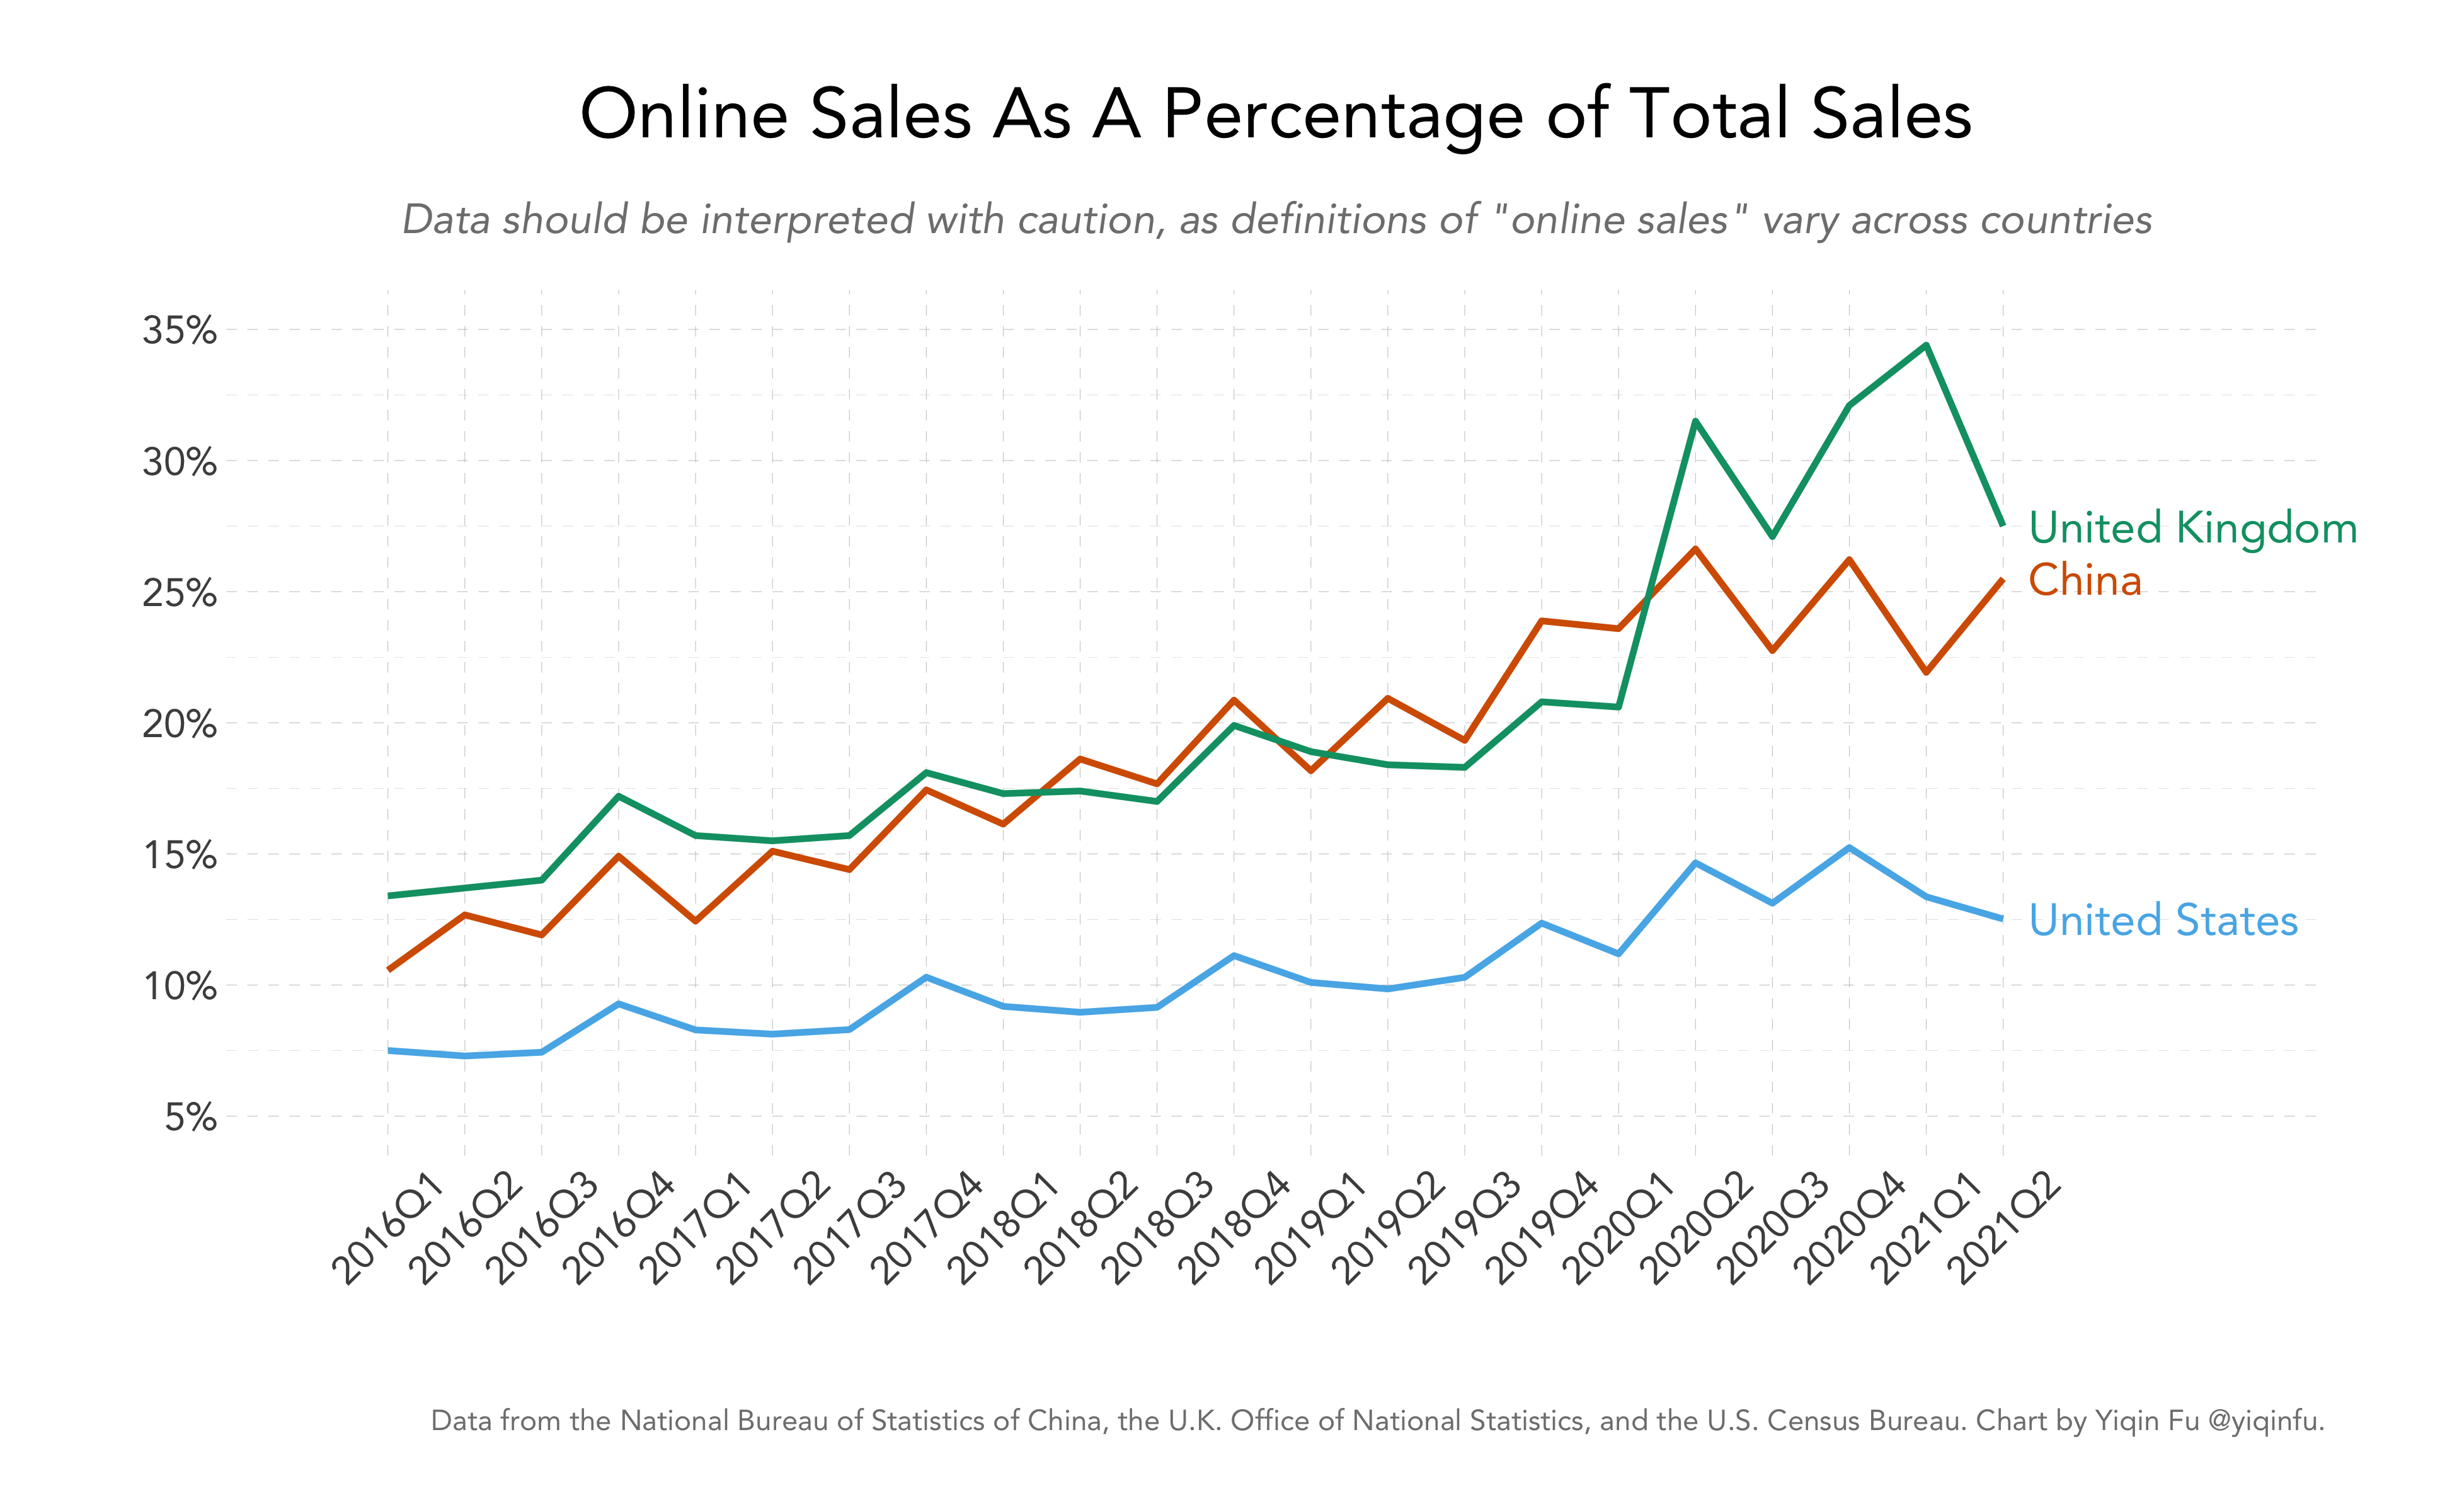
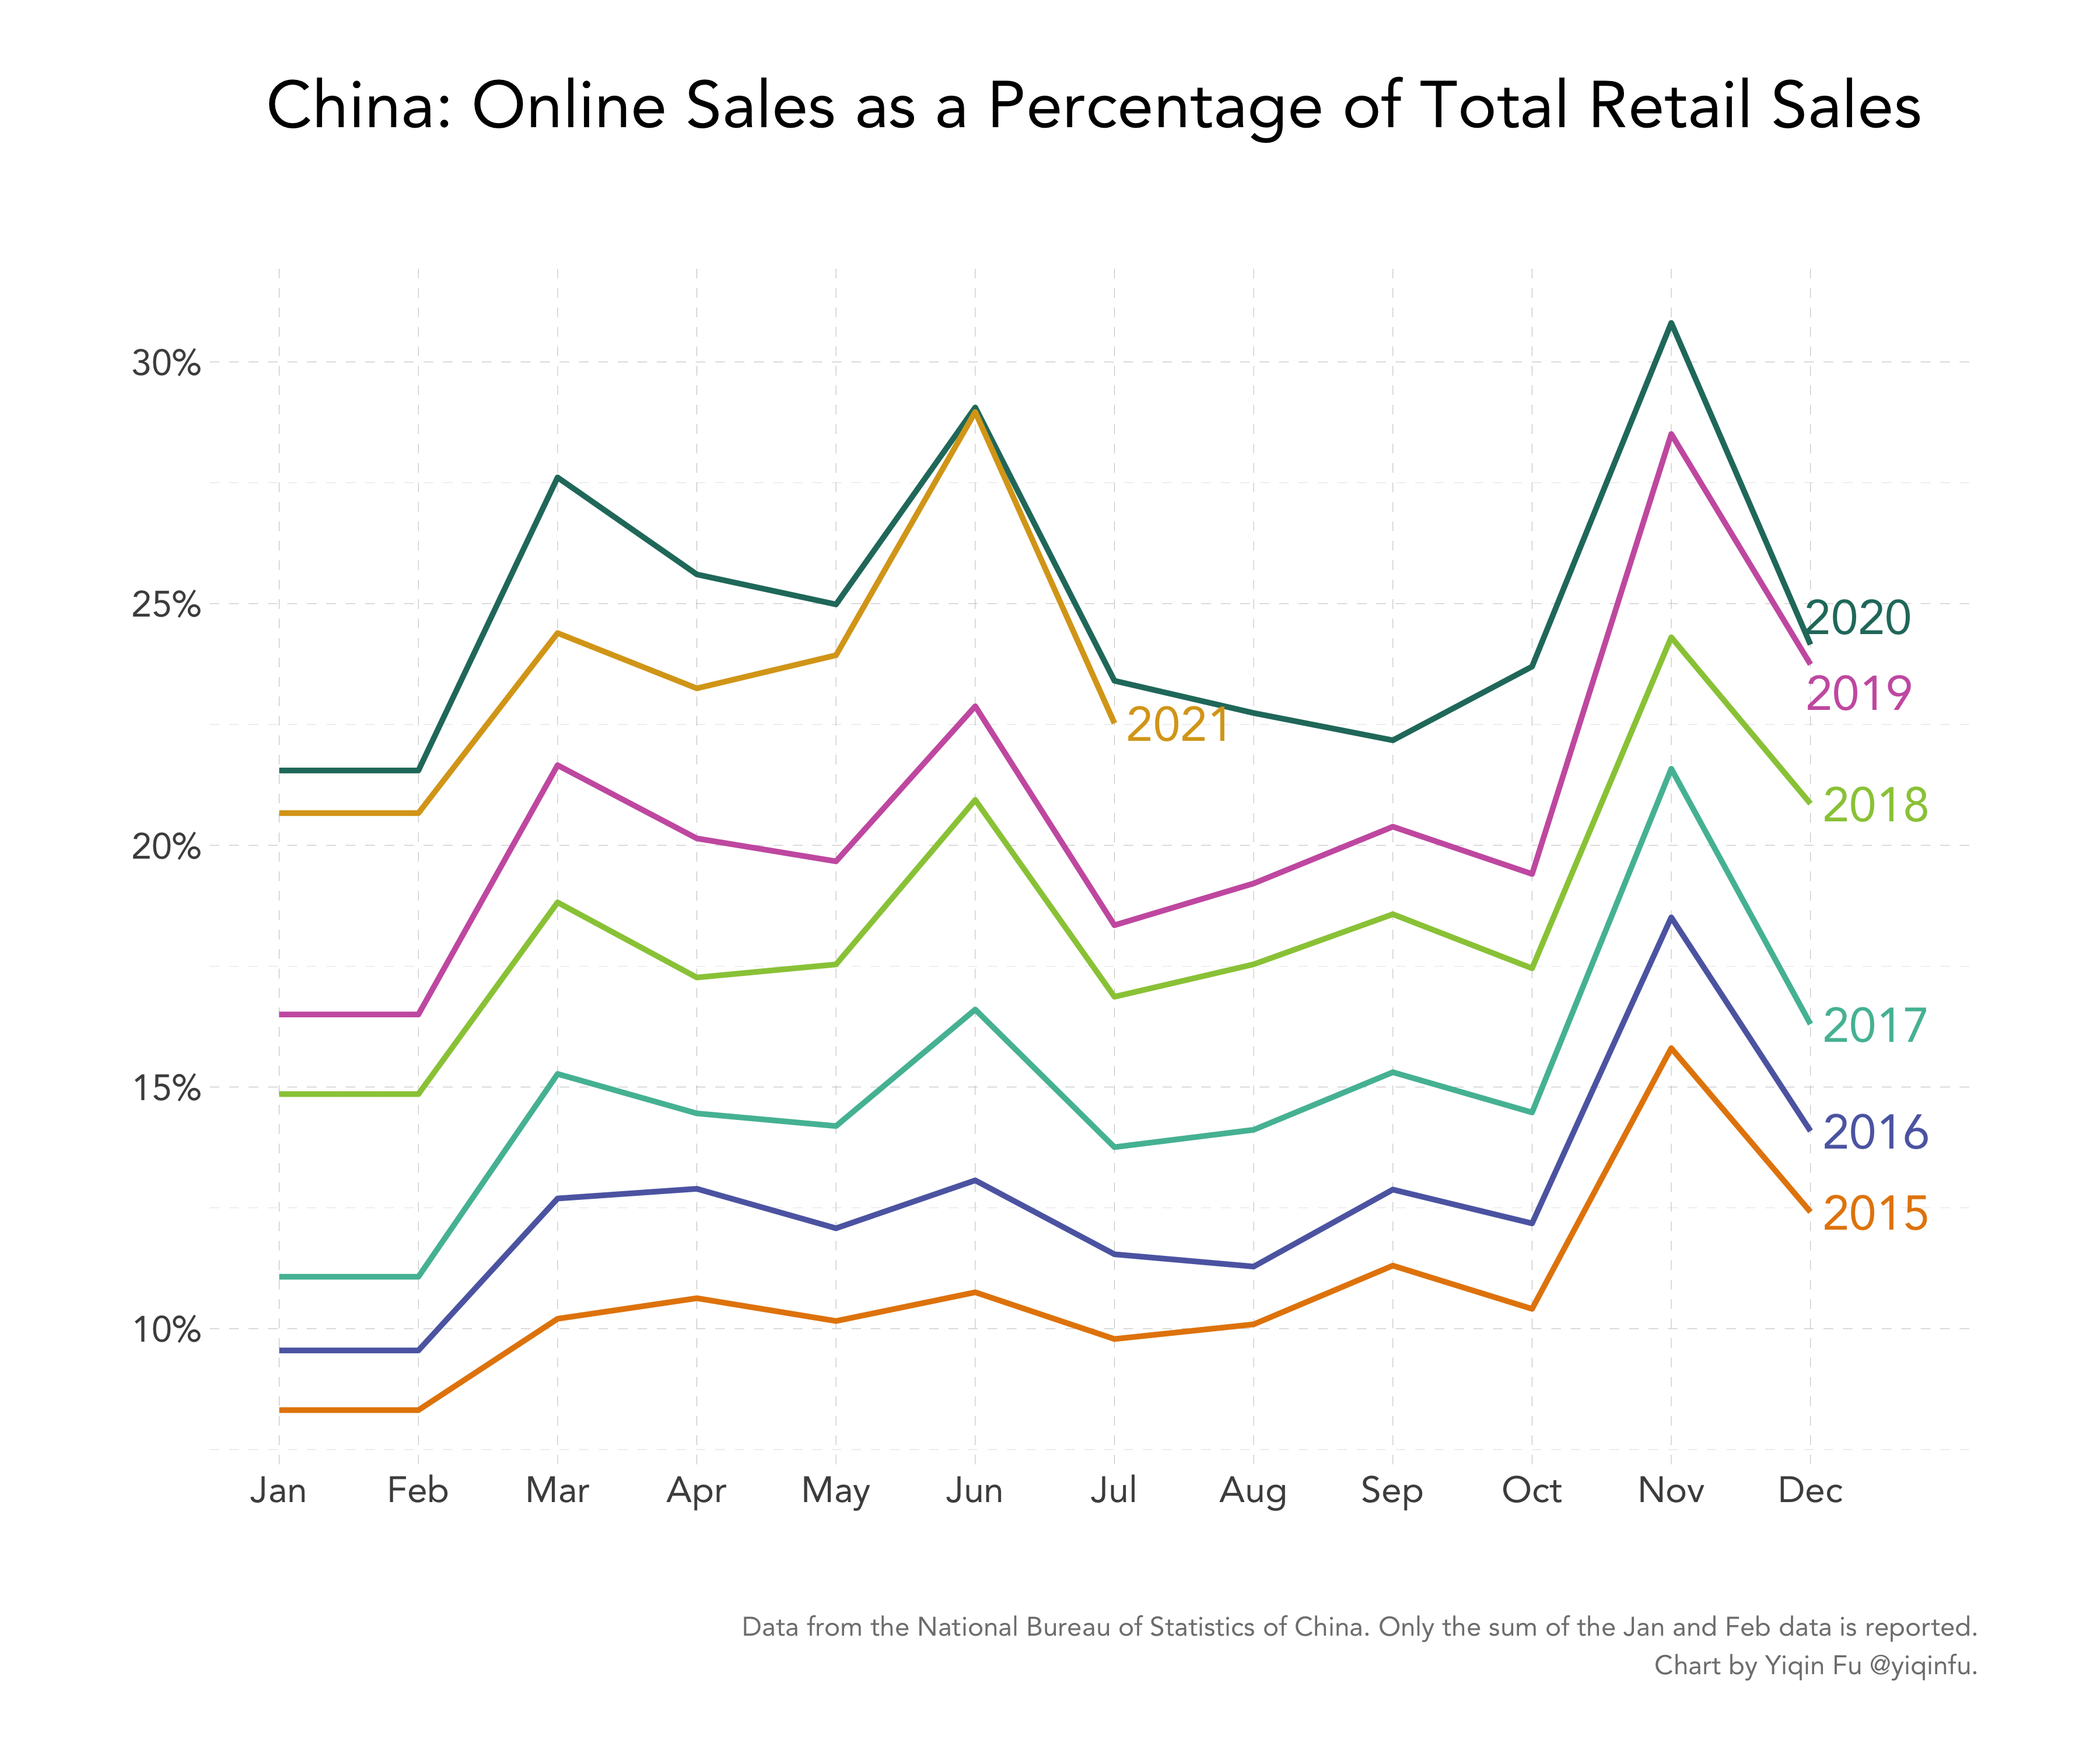
Caveats aside, the above chart still reveals some interesting seasonality patterns. Both China and the U.K. peak in the 4th quarter, likely due to Single’s Day and the Golden Week holiday in China and Boxing Day, Black Friday, and Cyber Monday in the U.K. The U.S. data is surprisingly smooth, but I suspect some definition or sampling issue is at work here. China’s numbers also have a unique peak in Q2, which can probably be attributed to the June 18 annual sale started by the e-commerce giant JD.com and quickly followed by others.
A Closer Look at China’s Retail Sales Data
Besides e-commerce sales, China’s statistics bureau also breaks down its monthly retail data into sub-categories. If we normalize the 2015 data to 1, we can see some interesting consumption trends. (Please note that the data below includes all channels of retail, not just online sales.)
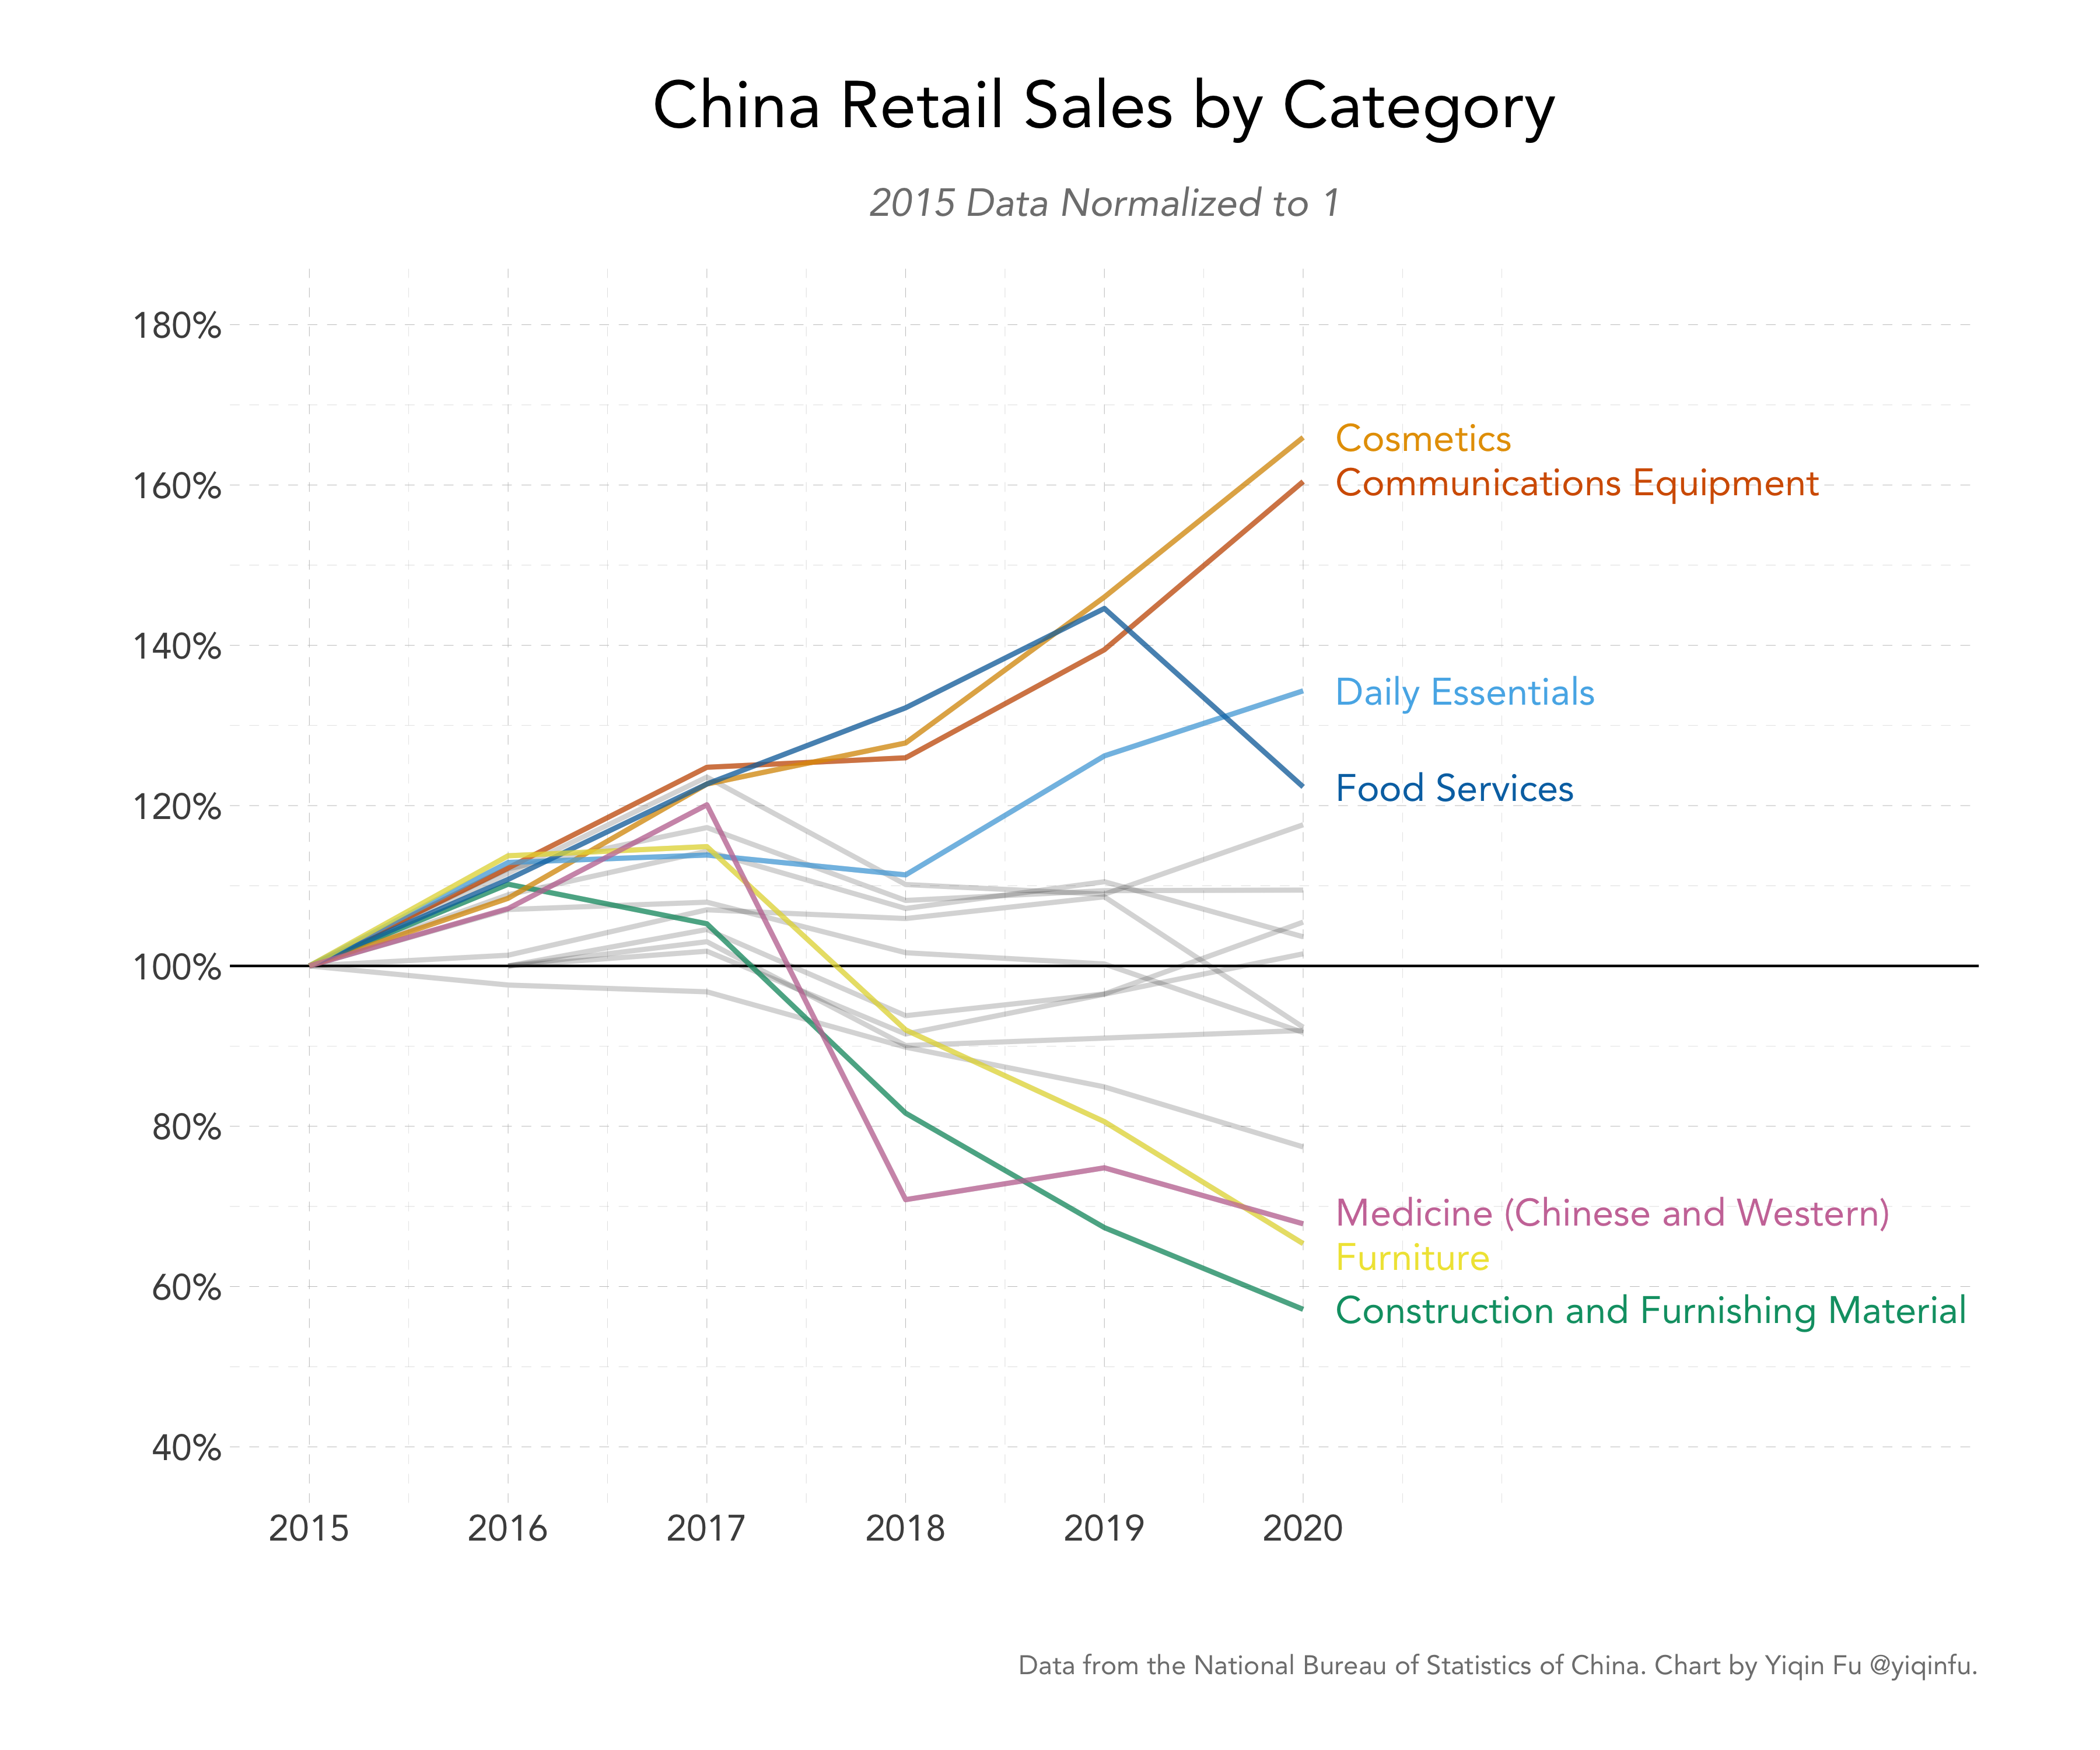
I do not know the exact definition of these sub-categories, but at first glance, Chinese people seem to be buying more phones, more makeup, and more takeout – each subcategory saw an increase of 30% compared to our baseline year 2015.
The 10% decrease in the sale of furnishing material also seems to confirm the conventional wisdom that Chinese people are buying fewer apartments. On the other hand, the 25% decline in drug sales over the past four years remains a mystery to me – it has to raise some alarm bells that drug sales dropped more than 35% compared to last year! Perhaps the Statistics Bureau changed its definition of what counts as “medicine”?
Finally, let us turn to total sales. The chart below shows that retail sales has been growing since 2015, albeit at a slower rate each year.
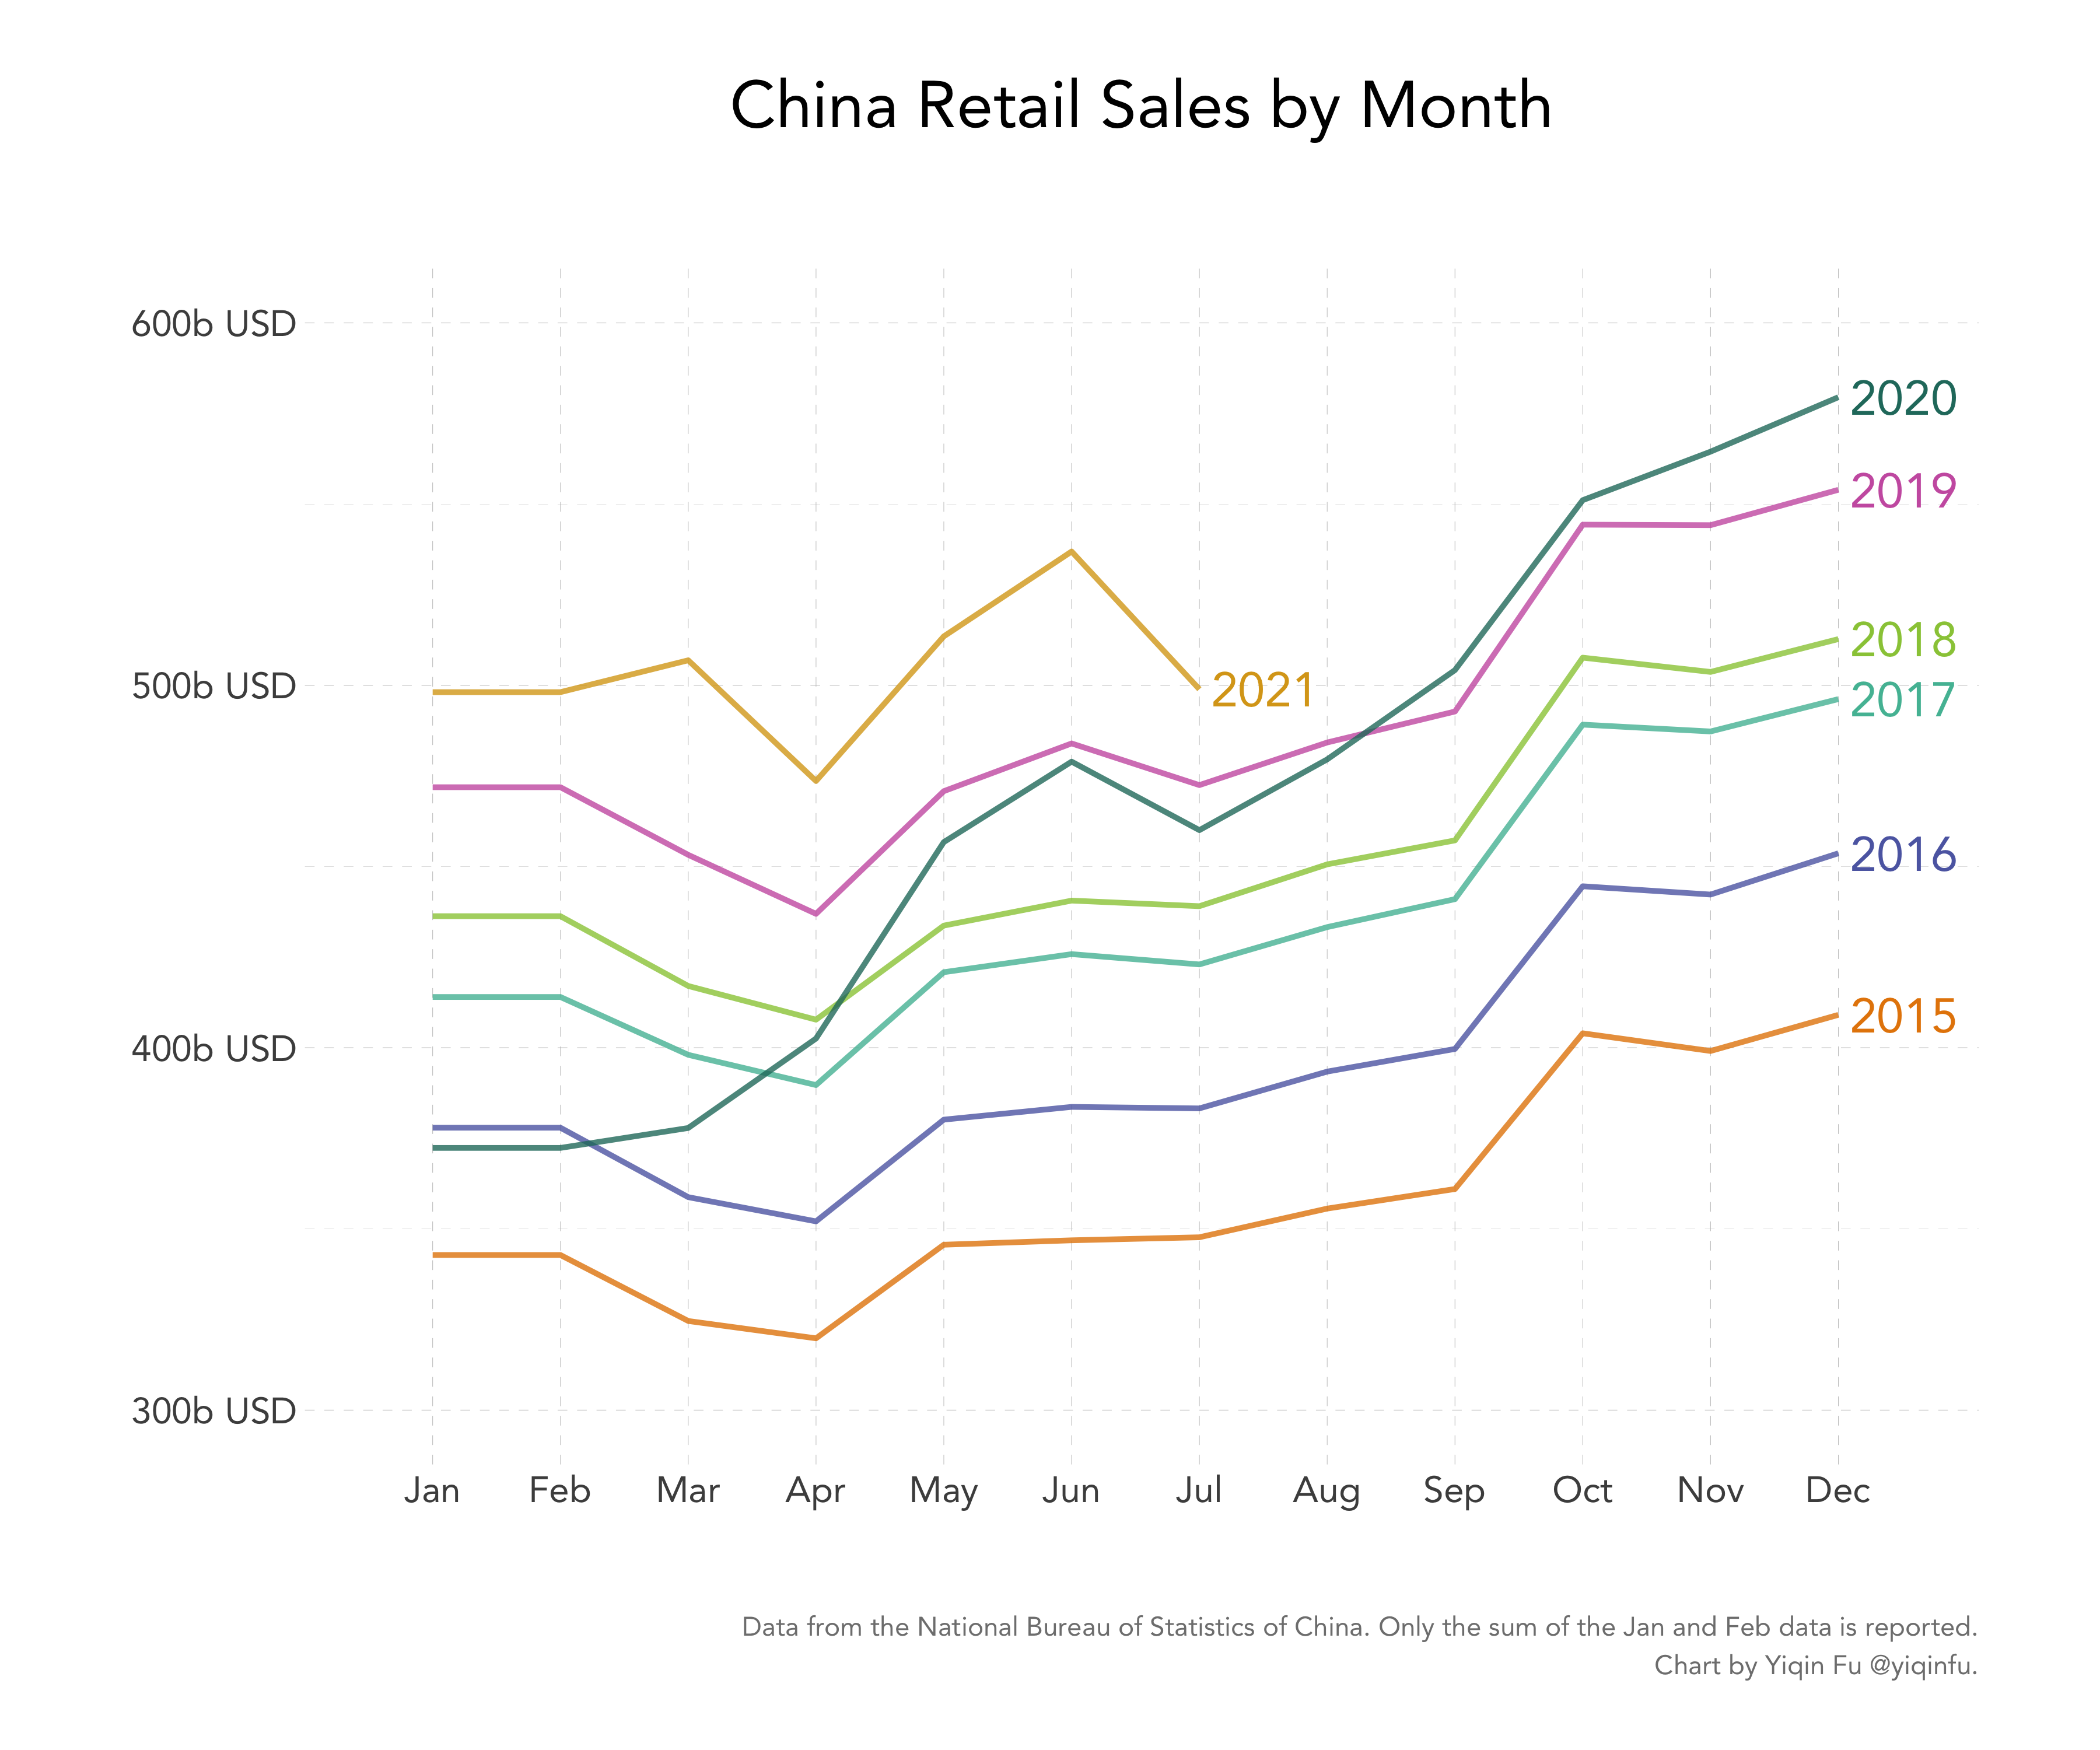
I am surprised to learn that despite a lack of any government holiday or cause for celebration, December is China’s biggest shopping month. December might be when many people receive their year-end bonuses, but some basic Internet research proves this theory wrong, as most people seem to receive theirs either in January (at the end of the Chinese New Year) or in April (at the end of the fiscal year).
So what makes people spend more money in December than, say, in November (the month of Single’s Day) or October (the month of the seven-day national holiday)? I will update this post when plausible theories emerge.
Here’s the percentage of online sales by year and month: (Have we reached peak online sales in 2021?)
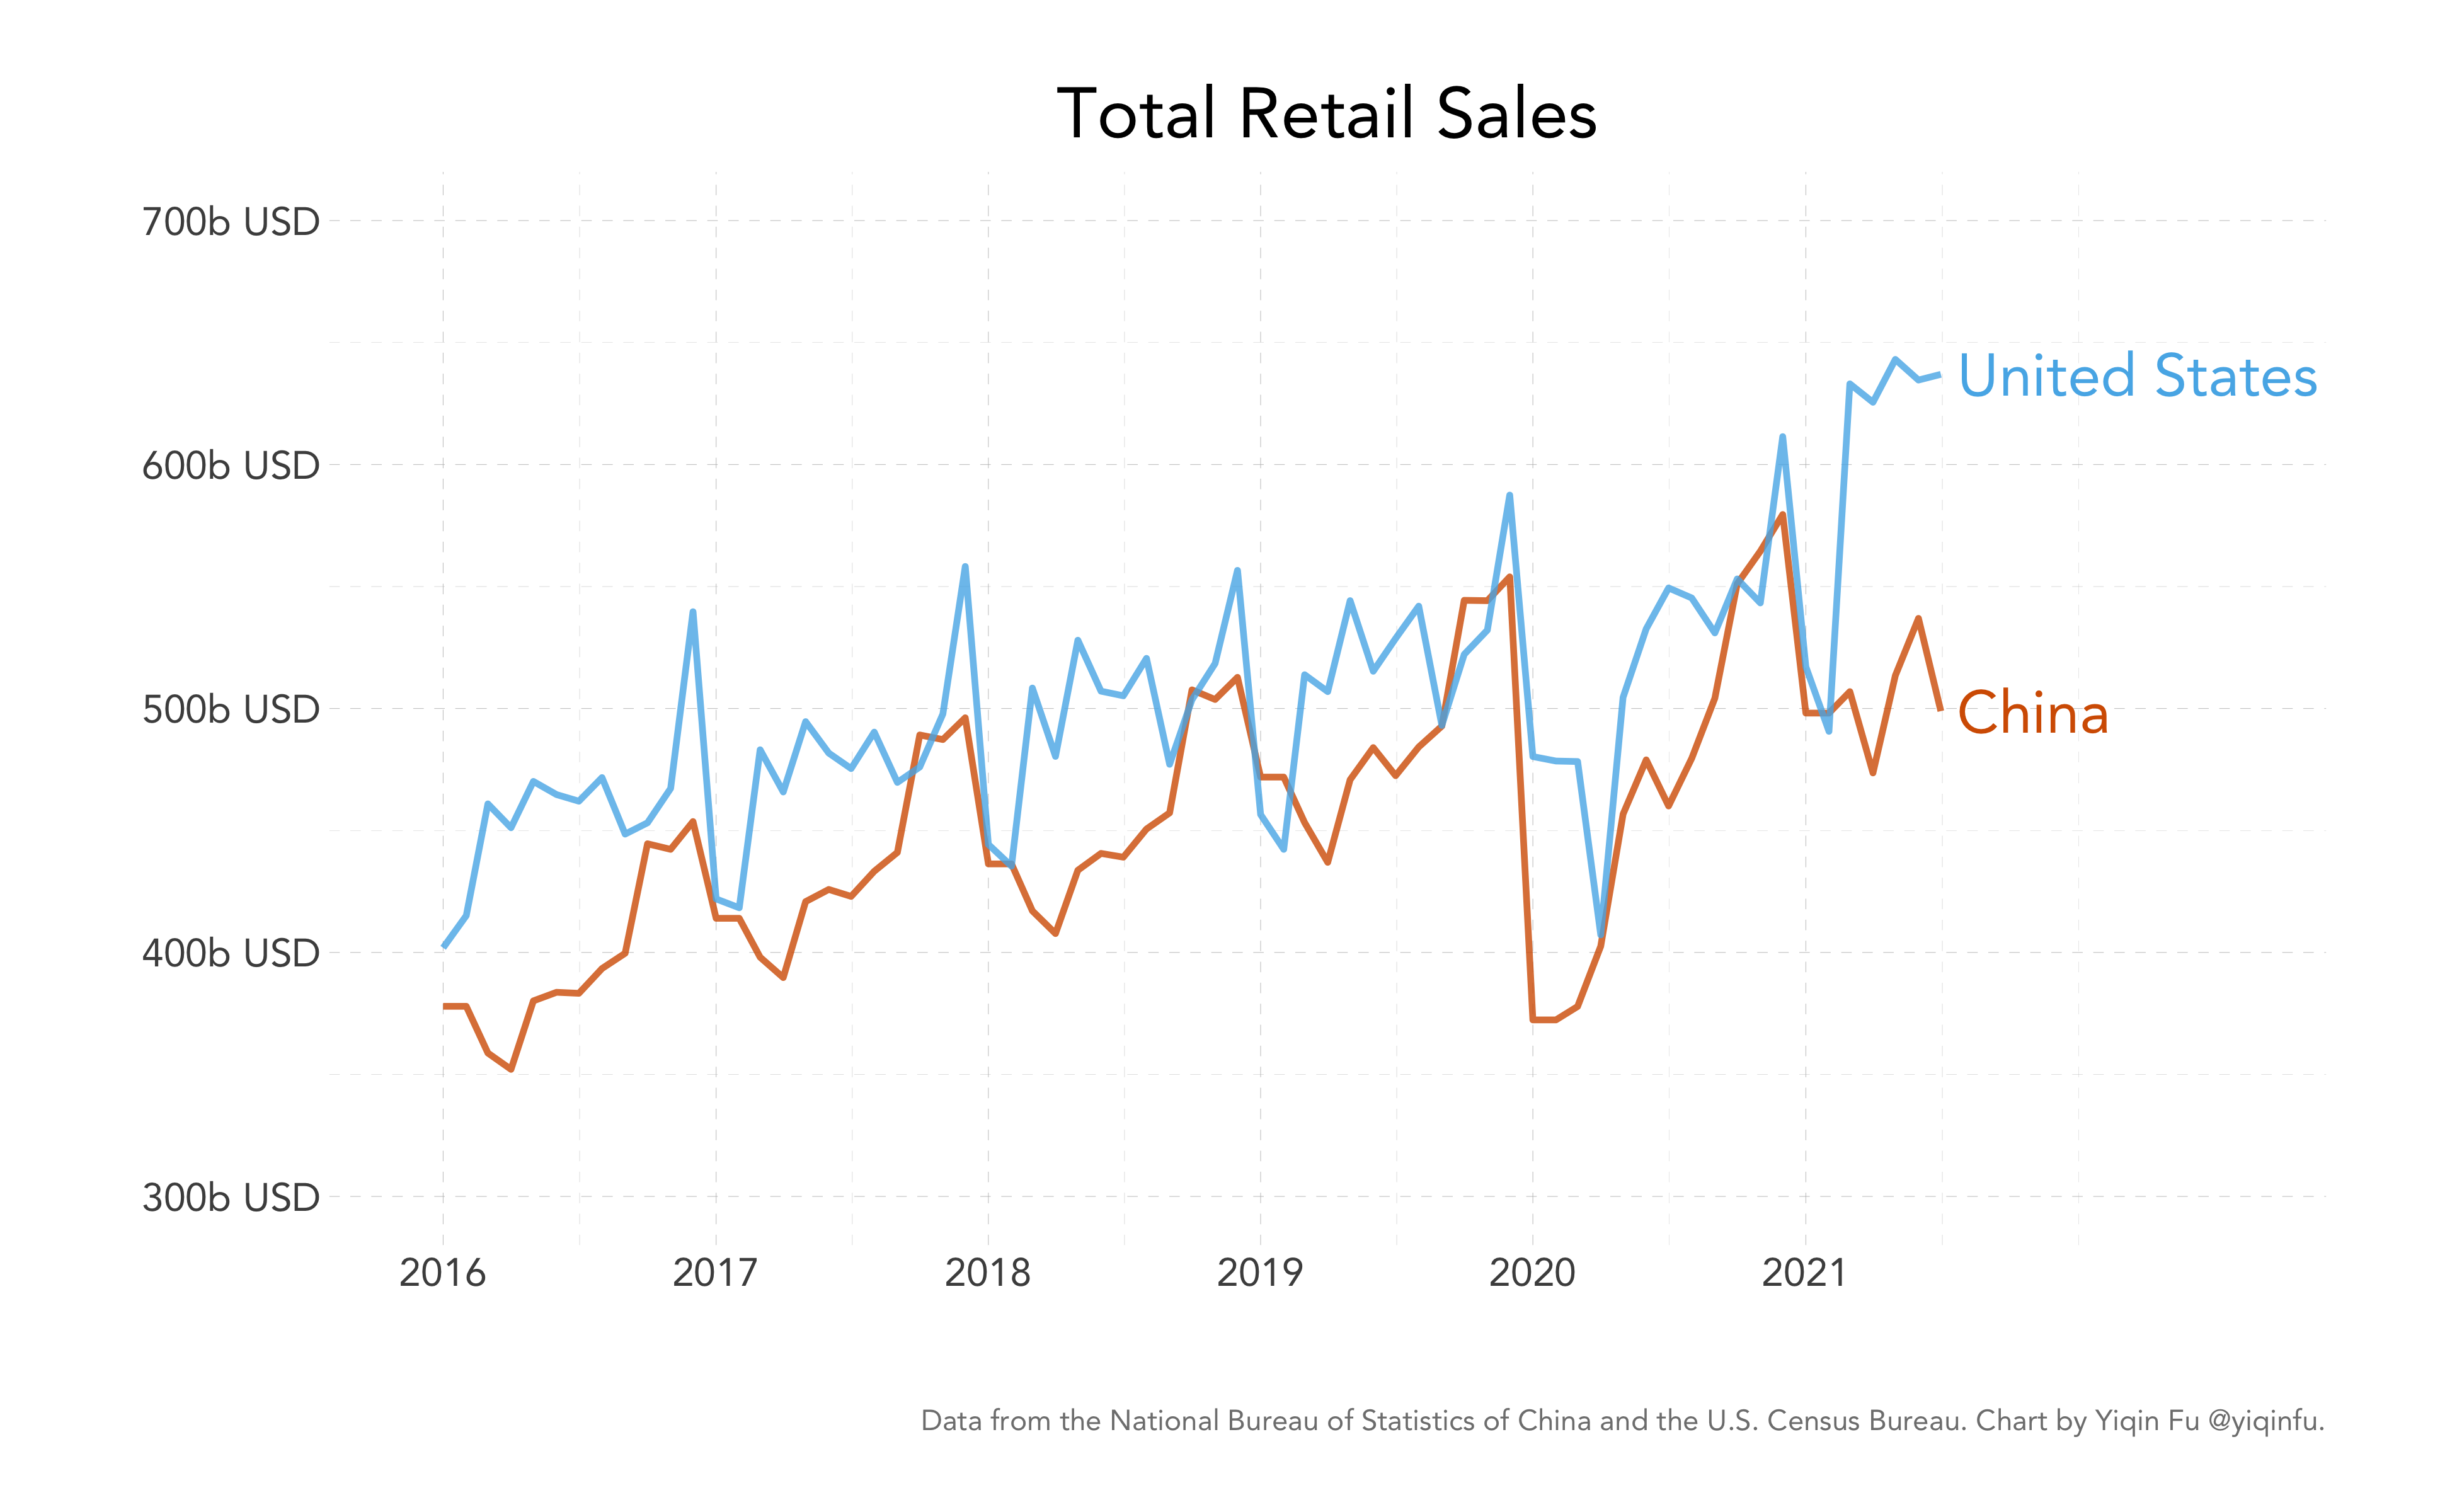
Total retail sales for China and the U.S.:
China was expected to surpass the U.S. in 2019, but the gap instead widened in the past few years. Chinese economists attribute the reversal to U.S. monetary policy and the two countries' different COVID-relief strategies (targeting businesses vs. targeting households directly).