No, the Chinese Start-Up World Is Not Collapsing
Jun 22, 2021 · 1082 words · 6-minute read
Tables and charts have been going around the Internet showing that the Chinese start-up world is no longer producing stars: The country purportedly added 14 unicorns in 2020 (cf. 73 in the U.S.) and a mere three in the first half of 2021 (cf. 126 in the U.S.).
The numbers didn’t sit right with me, so I checked some Chinese-language sources for the years 2020 and 2021. It turns out that CB Insights, the U.S.-based business analytics firm that produced the list of unicorns, missed more than 90% of the Chinese companies newly valued at $1B+ in that period. (I didn’t get the chance to check its data on American or European fundraising, but I assume it’s largely accurate.)
Corrected Trends with Validated Chinese Data
Below is my version of the unicorn chart, with the erroneous data plotted in a dashed line for reference.1
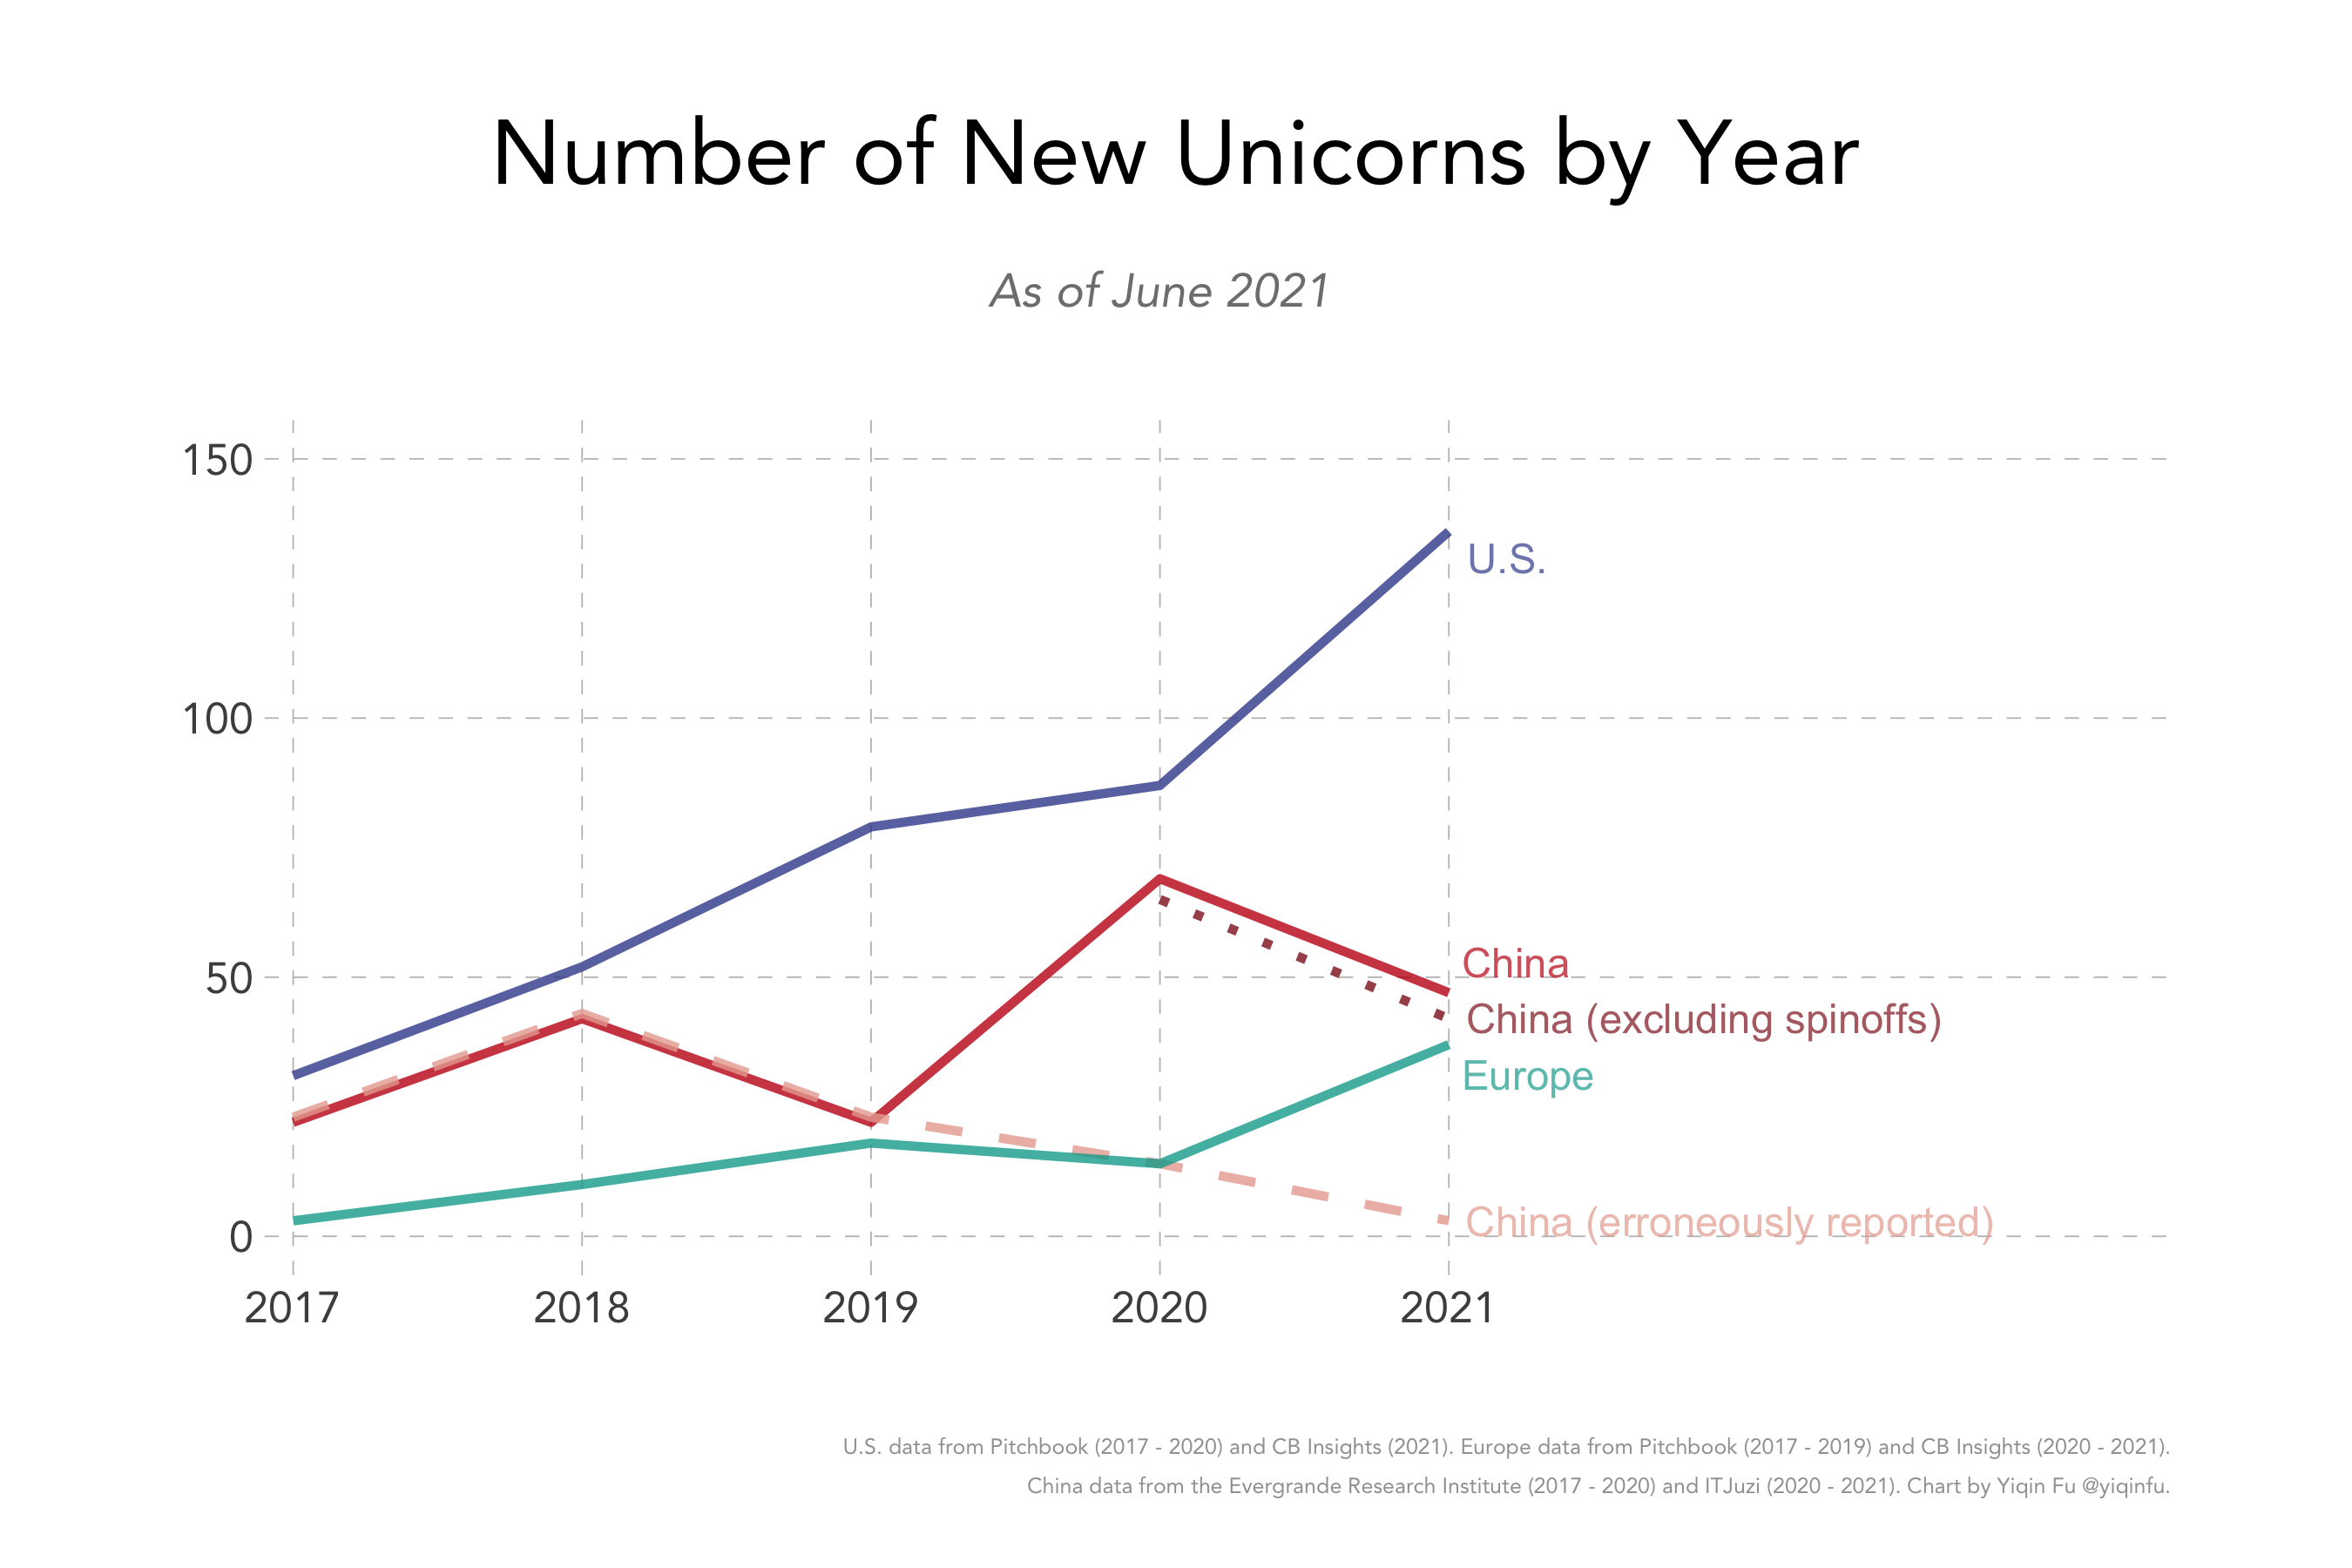
JD, Didi, SFExpress and a few other giants spun off their logistics and autonomous driving units, which immediately became unicorns themselves and appeared in the dataset. Once we exclude the spinoffs, Europe’s performance this year is almost matching China’s.
Given the data, our narrative could either be that Europe and the U.S. are being flooded with an unprecedented amount of venture capital – Tiger Global closed a deal in three days – or that on the side of the world, China is facing new setbacks.
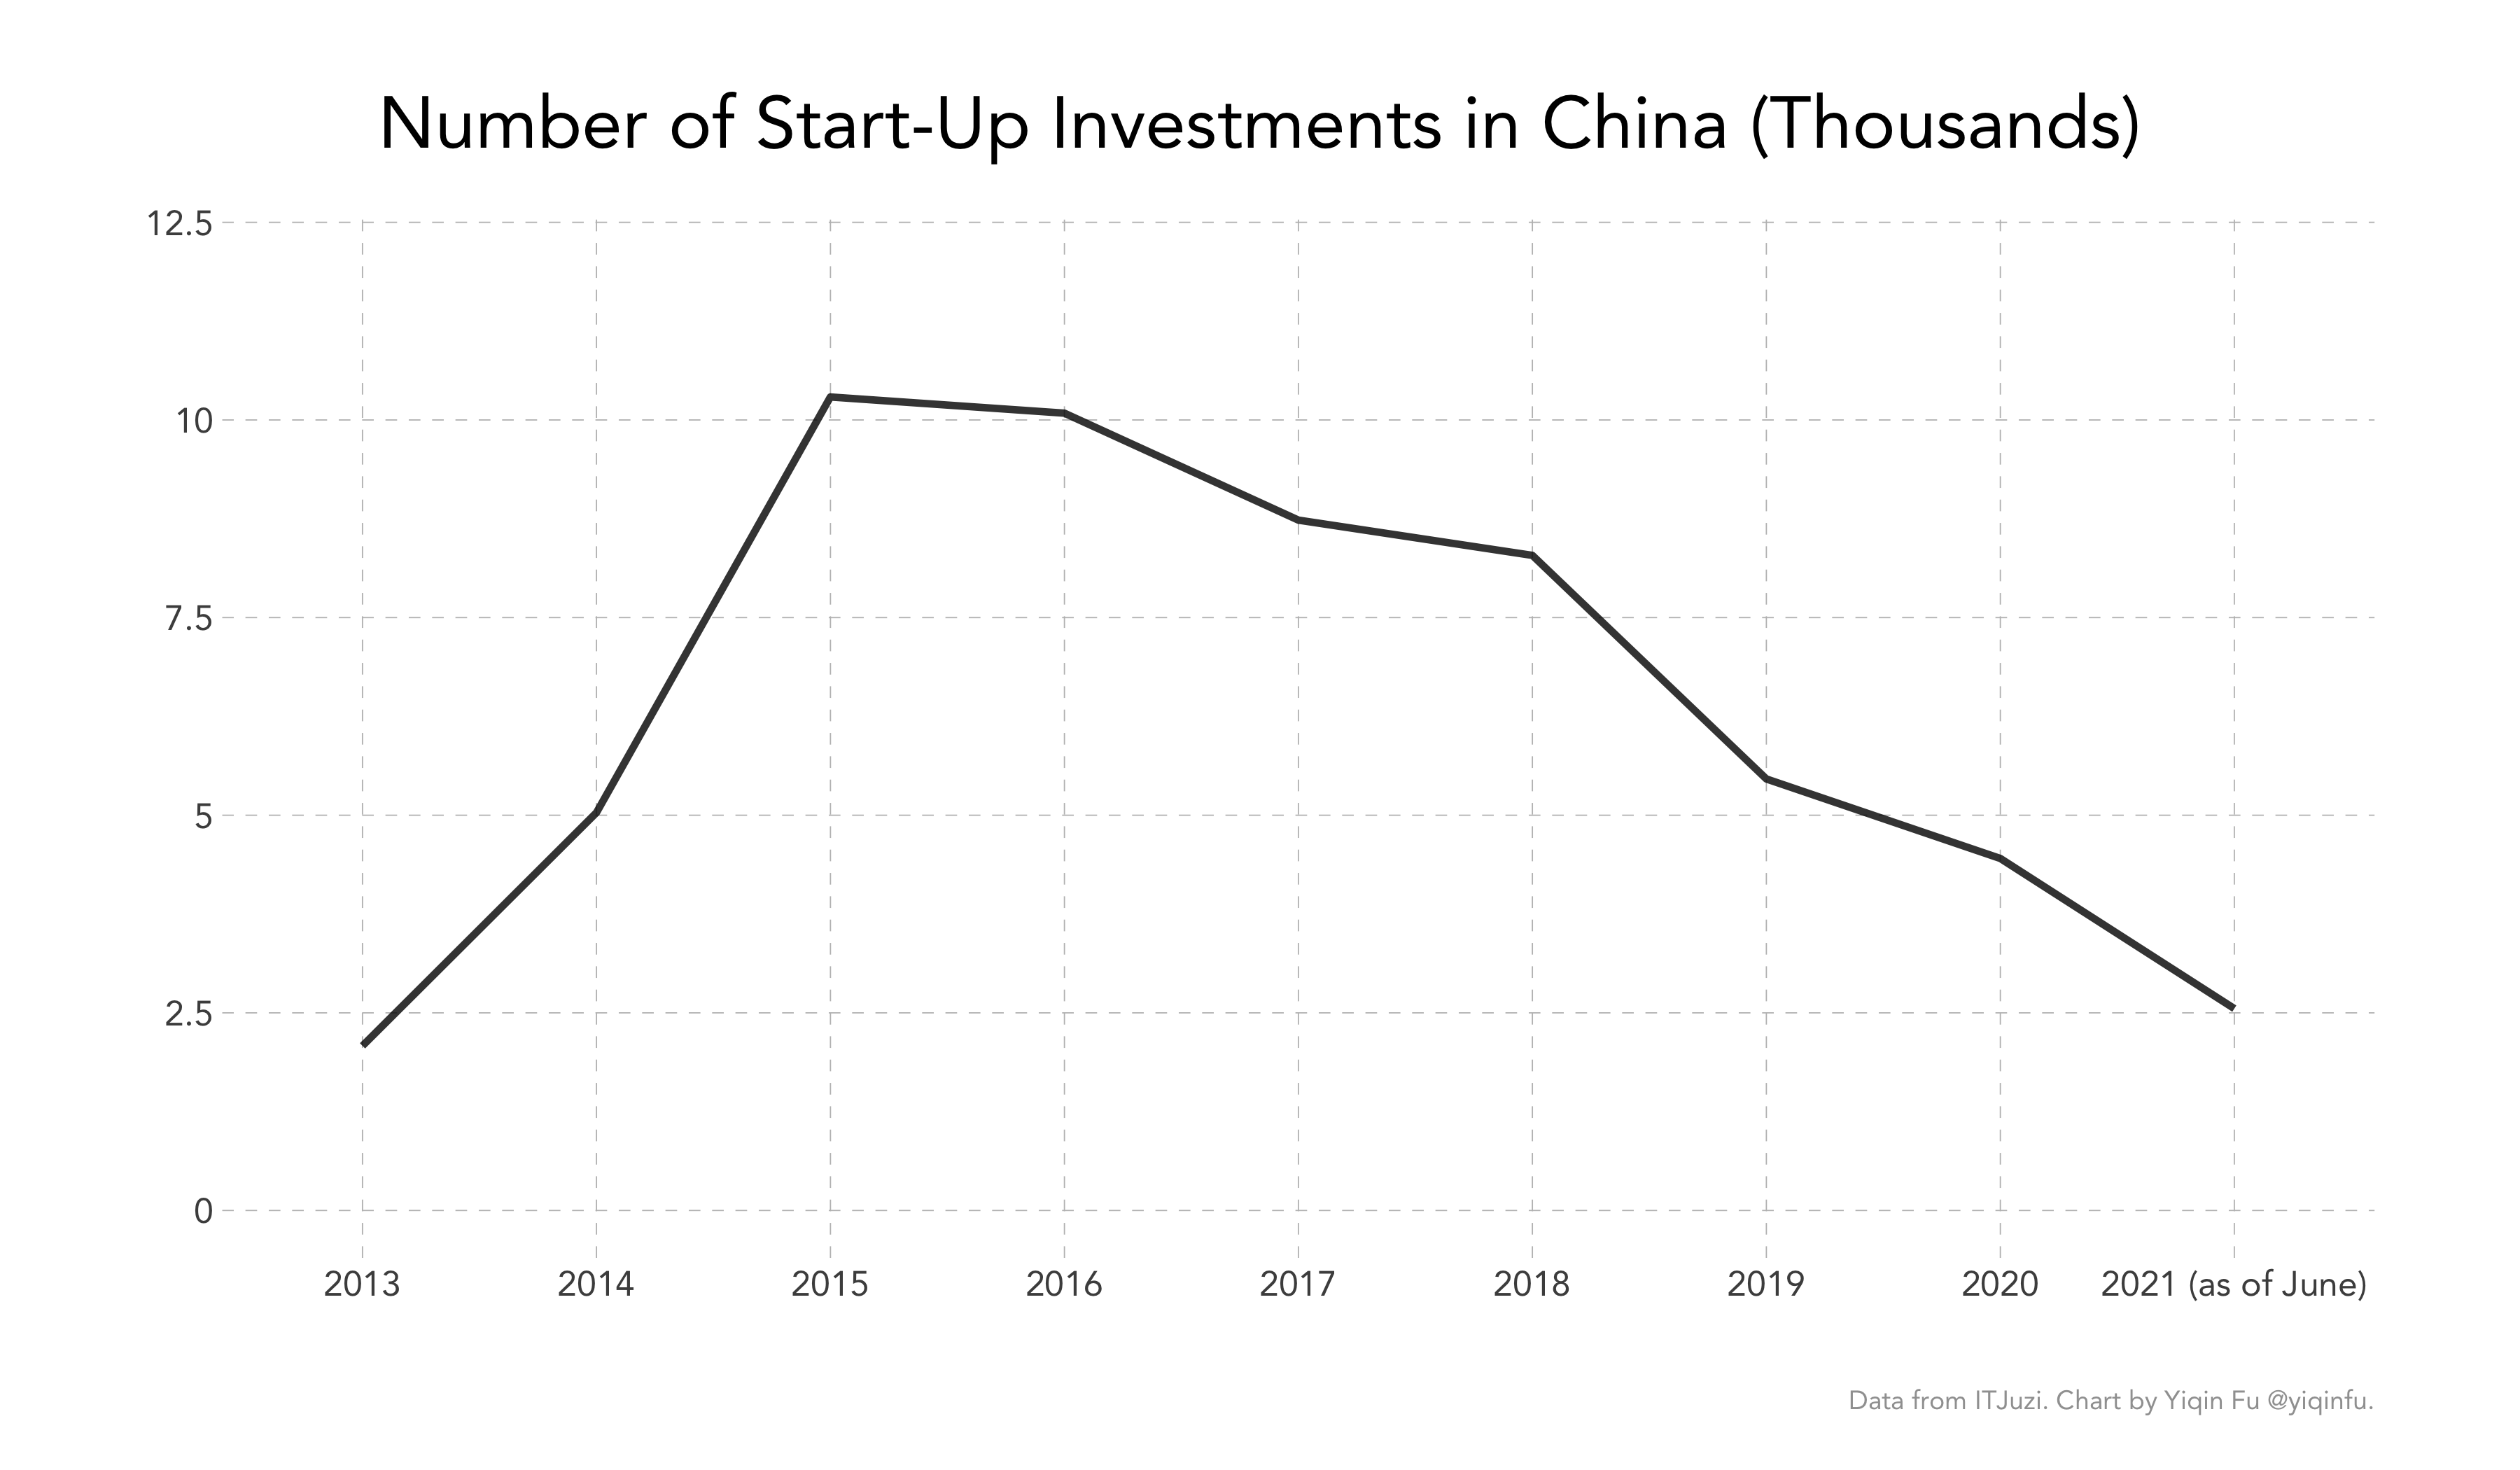
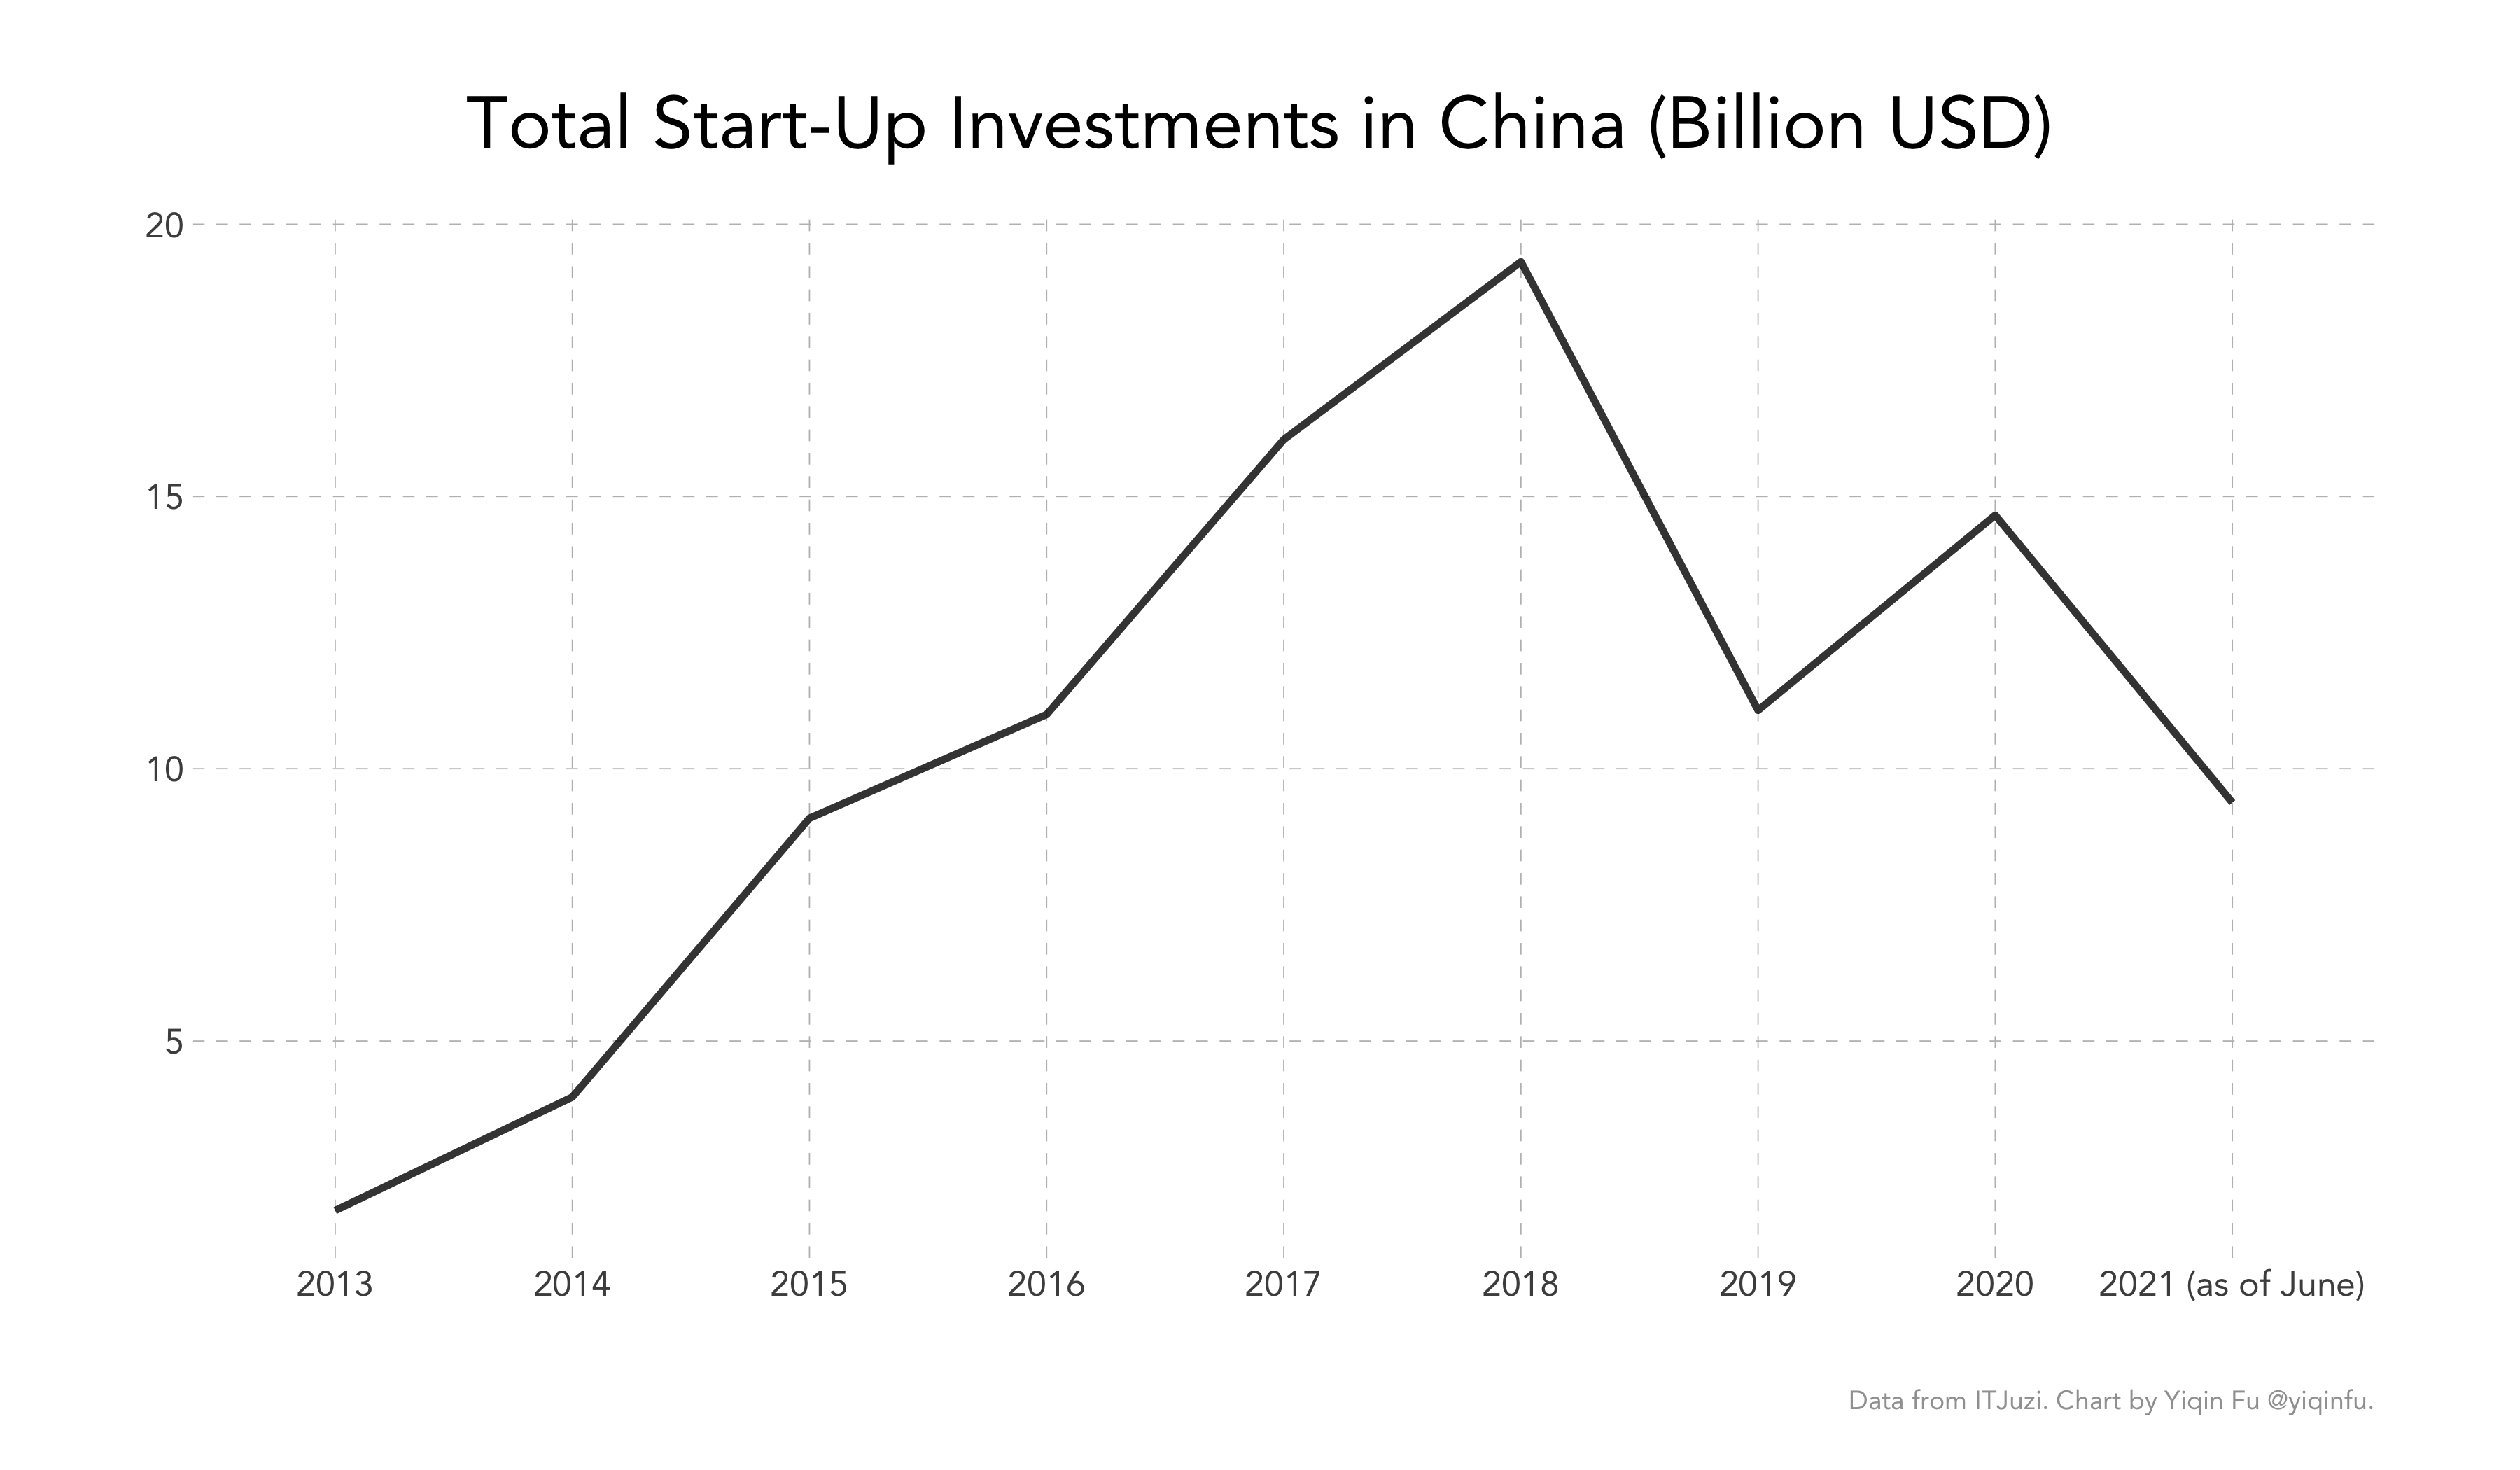
Chinese funds have trouble raising money, but we’ve known this fact since at least 2018 (see the charts below). The FT has written many articles on China’s “capital winter." Chinese VCs have talked at length about the changes (or non-changes) in their investment philosophy. I don’t see anything extraordinary about the current circumstances, but interpretation of data always varies based on one’s expectations.
Regardless of whether you see the patterns as evidence for the rise of Europe and the U.S. or the decline of China, it’s definitely far from the total decimation of the Chinese start-up world that the CB Insights data would imply.
I’ll discuss in a later section why the English-language sources are off by more than 90%. Before then, let’s inspect the corrected data a bit more.
Industry Breakdown of Unicorns by Geography
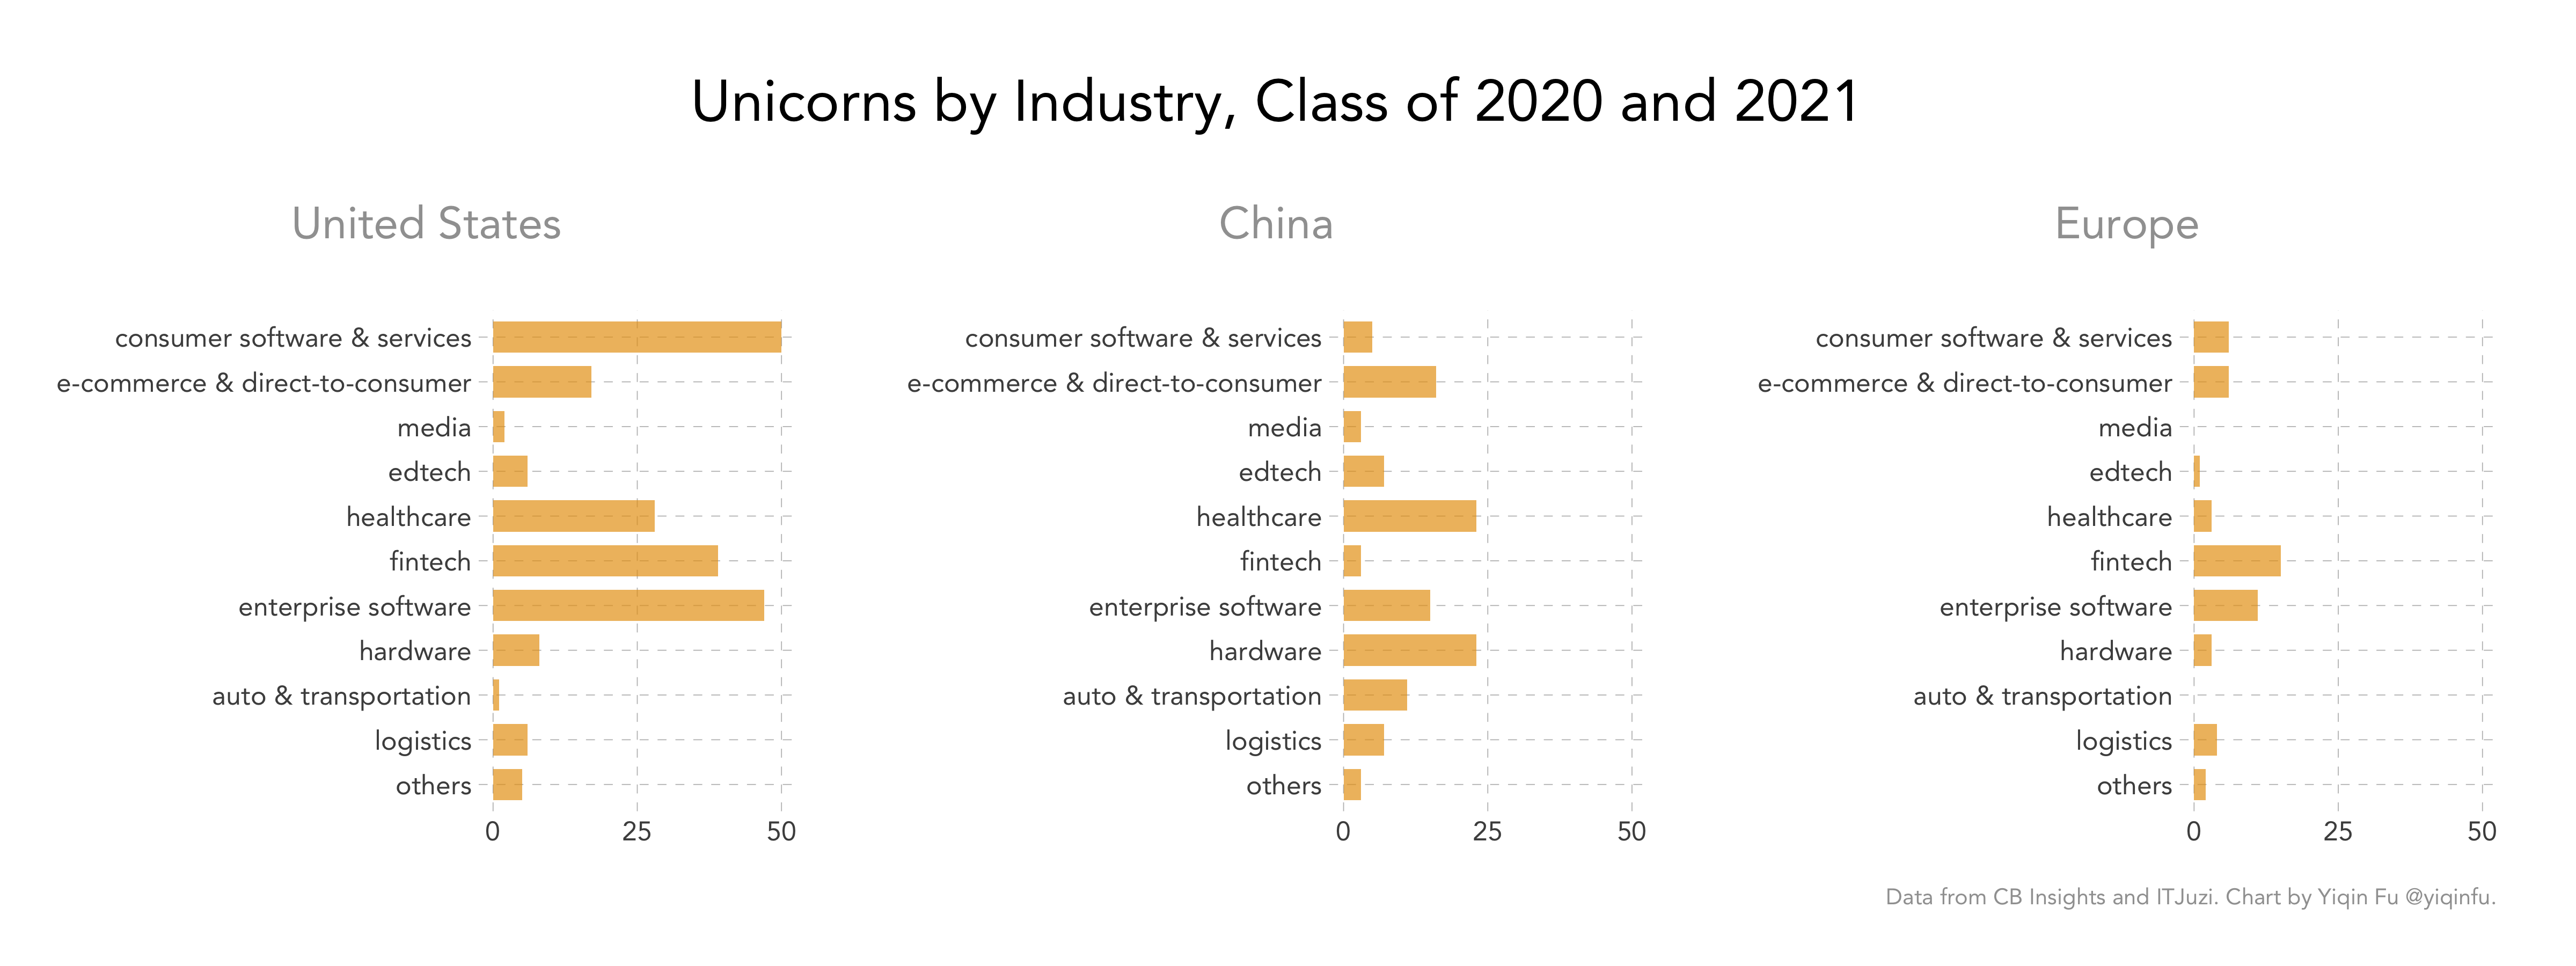
I was curious whether unicorns in certain countries were more likely to be in certain industries, so here’s the industry breakdown of new unicorns by country of origin:2
Observations:
-
The U.S. has a lot of successful consumer software companies, but they are almost nonexistent in China
-
Productivity:
- A lot of Chinese people’s work is still paper-based, so they don’t spend as much time on the desktop as those in the West;
- In situations where people do work digitally, the space that is occupied by Notion, Airtable, Loom, Hopin, etc. in the West is entirely dominated by incumbent giants such as Alibaba, Tencent, and ByteDance.
-
Entertainment:
- Entertainment in China is also dominated by the giants because entertainment functions are easily incorporated into the super-apps, not to mention the network effects.
-
-
Hardware is huge in China because of the government’s push for self-sufficiency in chip-manufacturing. Most hardware unicorns in China are in the semiconductor supply chain. Most hardware unicorns in the U.S. are space start-ups.
-
Healthcare and fintech are hot globally (for obvious reasons). Europe stands out as comparatively strong in fintech – Does fragmentation actually work to Europe’s advantage in this case? It could also be that fintech is less capital intensive and less dependent on physical interactions compared to some of the other industries?
Why Is the Data So Hard to Find?
The data validation process took me more than 12 hours, and I would’ve spent even more time had I not been maintaining a related firm-level dataset for research purposes.
ITJuzi was the Chinese Crunchbase-equivalent that I went to for validation, but quite often the data didn’t match up with that from the Evergrande Research Institute’s annual report, which was another authoritative source widely cited by Chinese financial media.
Why were there so many discrepancies if all we were dealing with were 50ish prominent companies? I reached out to a friend who works at Hillhouse. They kindly explained that all of these analytics firms got their data from media reports, but when investors and founders refrained from media publicity following a fundraising round, the database would become inaccurate. These omissions happen often enough that many institutional investors now maintain in-house databases that pull information from government business registries rather than media reports. (If you’ve ever worked with Chinese data though, you’d know that scraping or even accessing the Chinese business registries is a monumental engineering effort.)
Another point of confusion comes from the fact that some unicorns exit. The CB Insights “unicorns table” is a list of companies currently valued at $1B+. If we want to know how many unicorns a country added in 2017, we should look up the list that came out in 2017 rather than filtering on the list that came out in 2021 – Many new unicorns from back then would have exited by 2021. The difference of five or ten companies might not matter if the numbers we are talking about are in the hundreds, but since we are dealing with 20 or 50 companies at a time, missing five or ten here and there would drastically change the overall trend.
For future reference, here are the Chinese-language sources I consulted during the validation process:
- ITJuzi (additional work required if starting from English-language company names)
- Evergrande Research Institute annual reports
- Tianyancha and/or Qichacha (third-party aggregators that scrape government registries; IP addresses outside of China are banned)
- Media reports (Google is usually sufficient)
My biggest takeaway from this arduous manual exercise is that “incredible” data sometimes is precisely not that credible. We ought to apply extra scrutiny before we can start pontificating about the potential explanations and implications. We are particularly susceptible to being fooled by “incredible data” when it points in the direction of our prior beliefs. Fortunately we have cognitive and computational tools to help us.
-
Due to time constraints, I did not cross-check the data for the years prior to 2020. ↩︎
-
I had to crudely classify the companies myself because I couldn’t find a harmonized set of labels across geographies. CB Insights doesn’t have a consistent coding rule: Companies that directly compete with each other are sometimes put under different categories; pure software and pure hardware companies are sometimes grouped together; so are some consumer- and business-facing companies as well. Pitchbook might be better, but I don’t have access. ↩︎