Attitudes Towards Science, Technology, and Surveillance in 49 Countries
Jun 9, 2021 · 673 words · 4-minute read
The World Values Survey has been gathering public opinion since the 1980s. In the most recent wave conducted between 2017 and 2021, more than 70,000 people in 49 countries were interviewed using random probability representative sample designs. The survey asked, among other. things, people’s attitudes towards science and technology as well as government surveillance. In this post, I plot the country averages, look at aggregate-level correlations with GDP an democracy, and explore gender differences in attitudes.
Cross-Country Comparison of Attitudes Towards Science and Technology
I combine people’s answers to the six “science and technology” questions into an index and plot the country average of what I call “optimism in science and technology”:
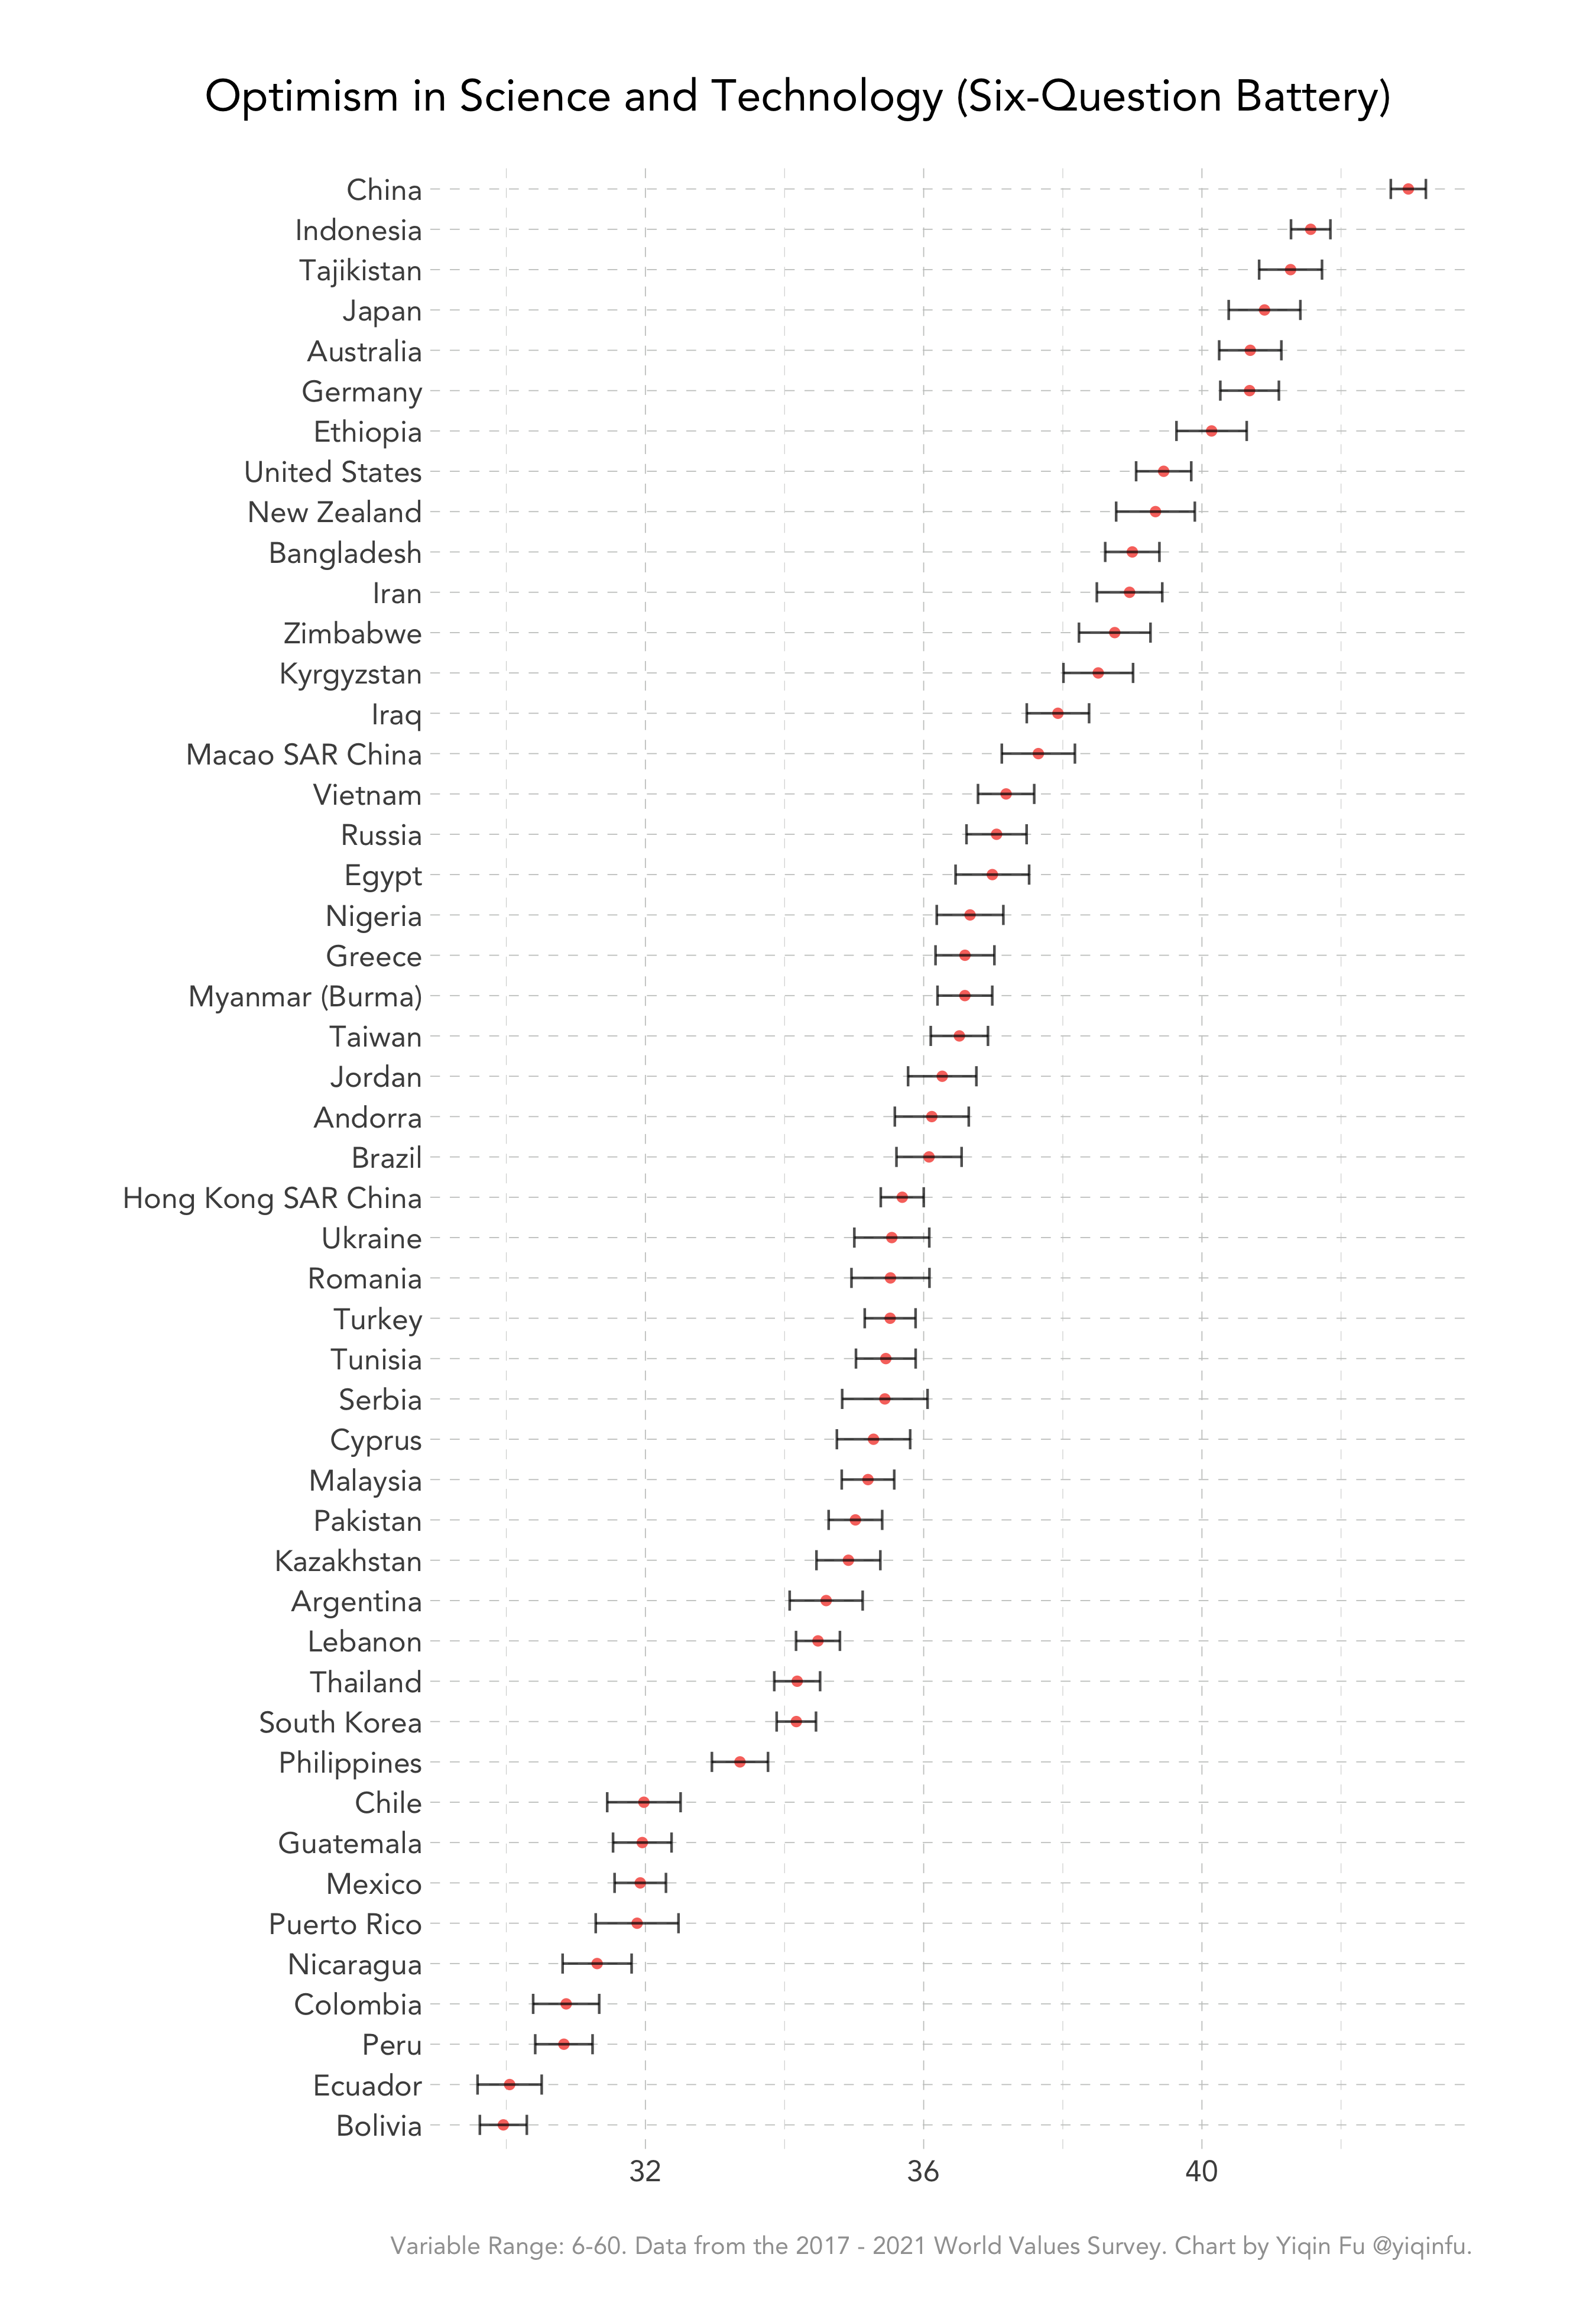
The questions ask people’s agreement with the following statements: (1-10 scale)
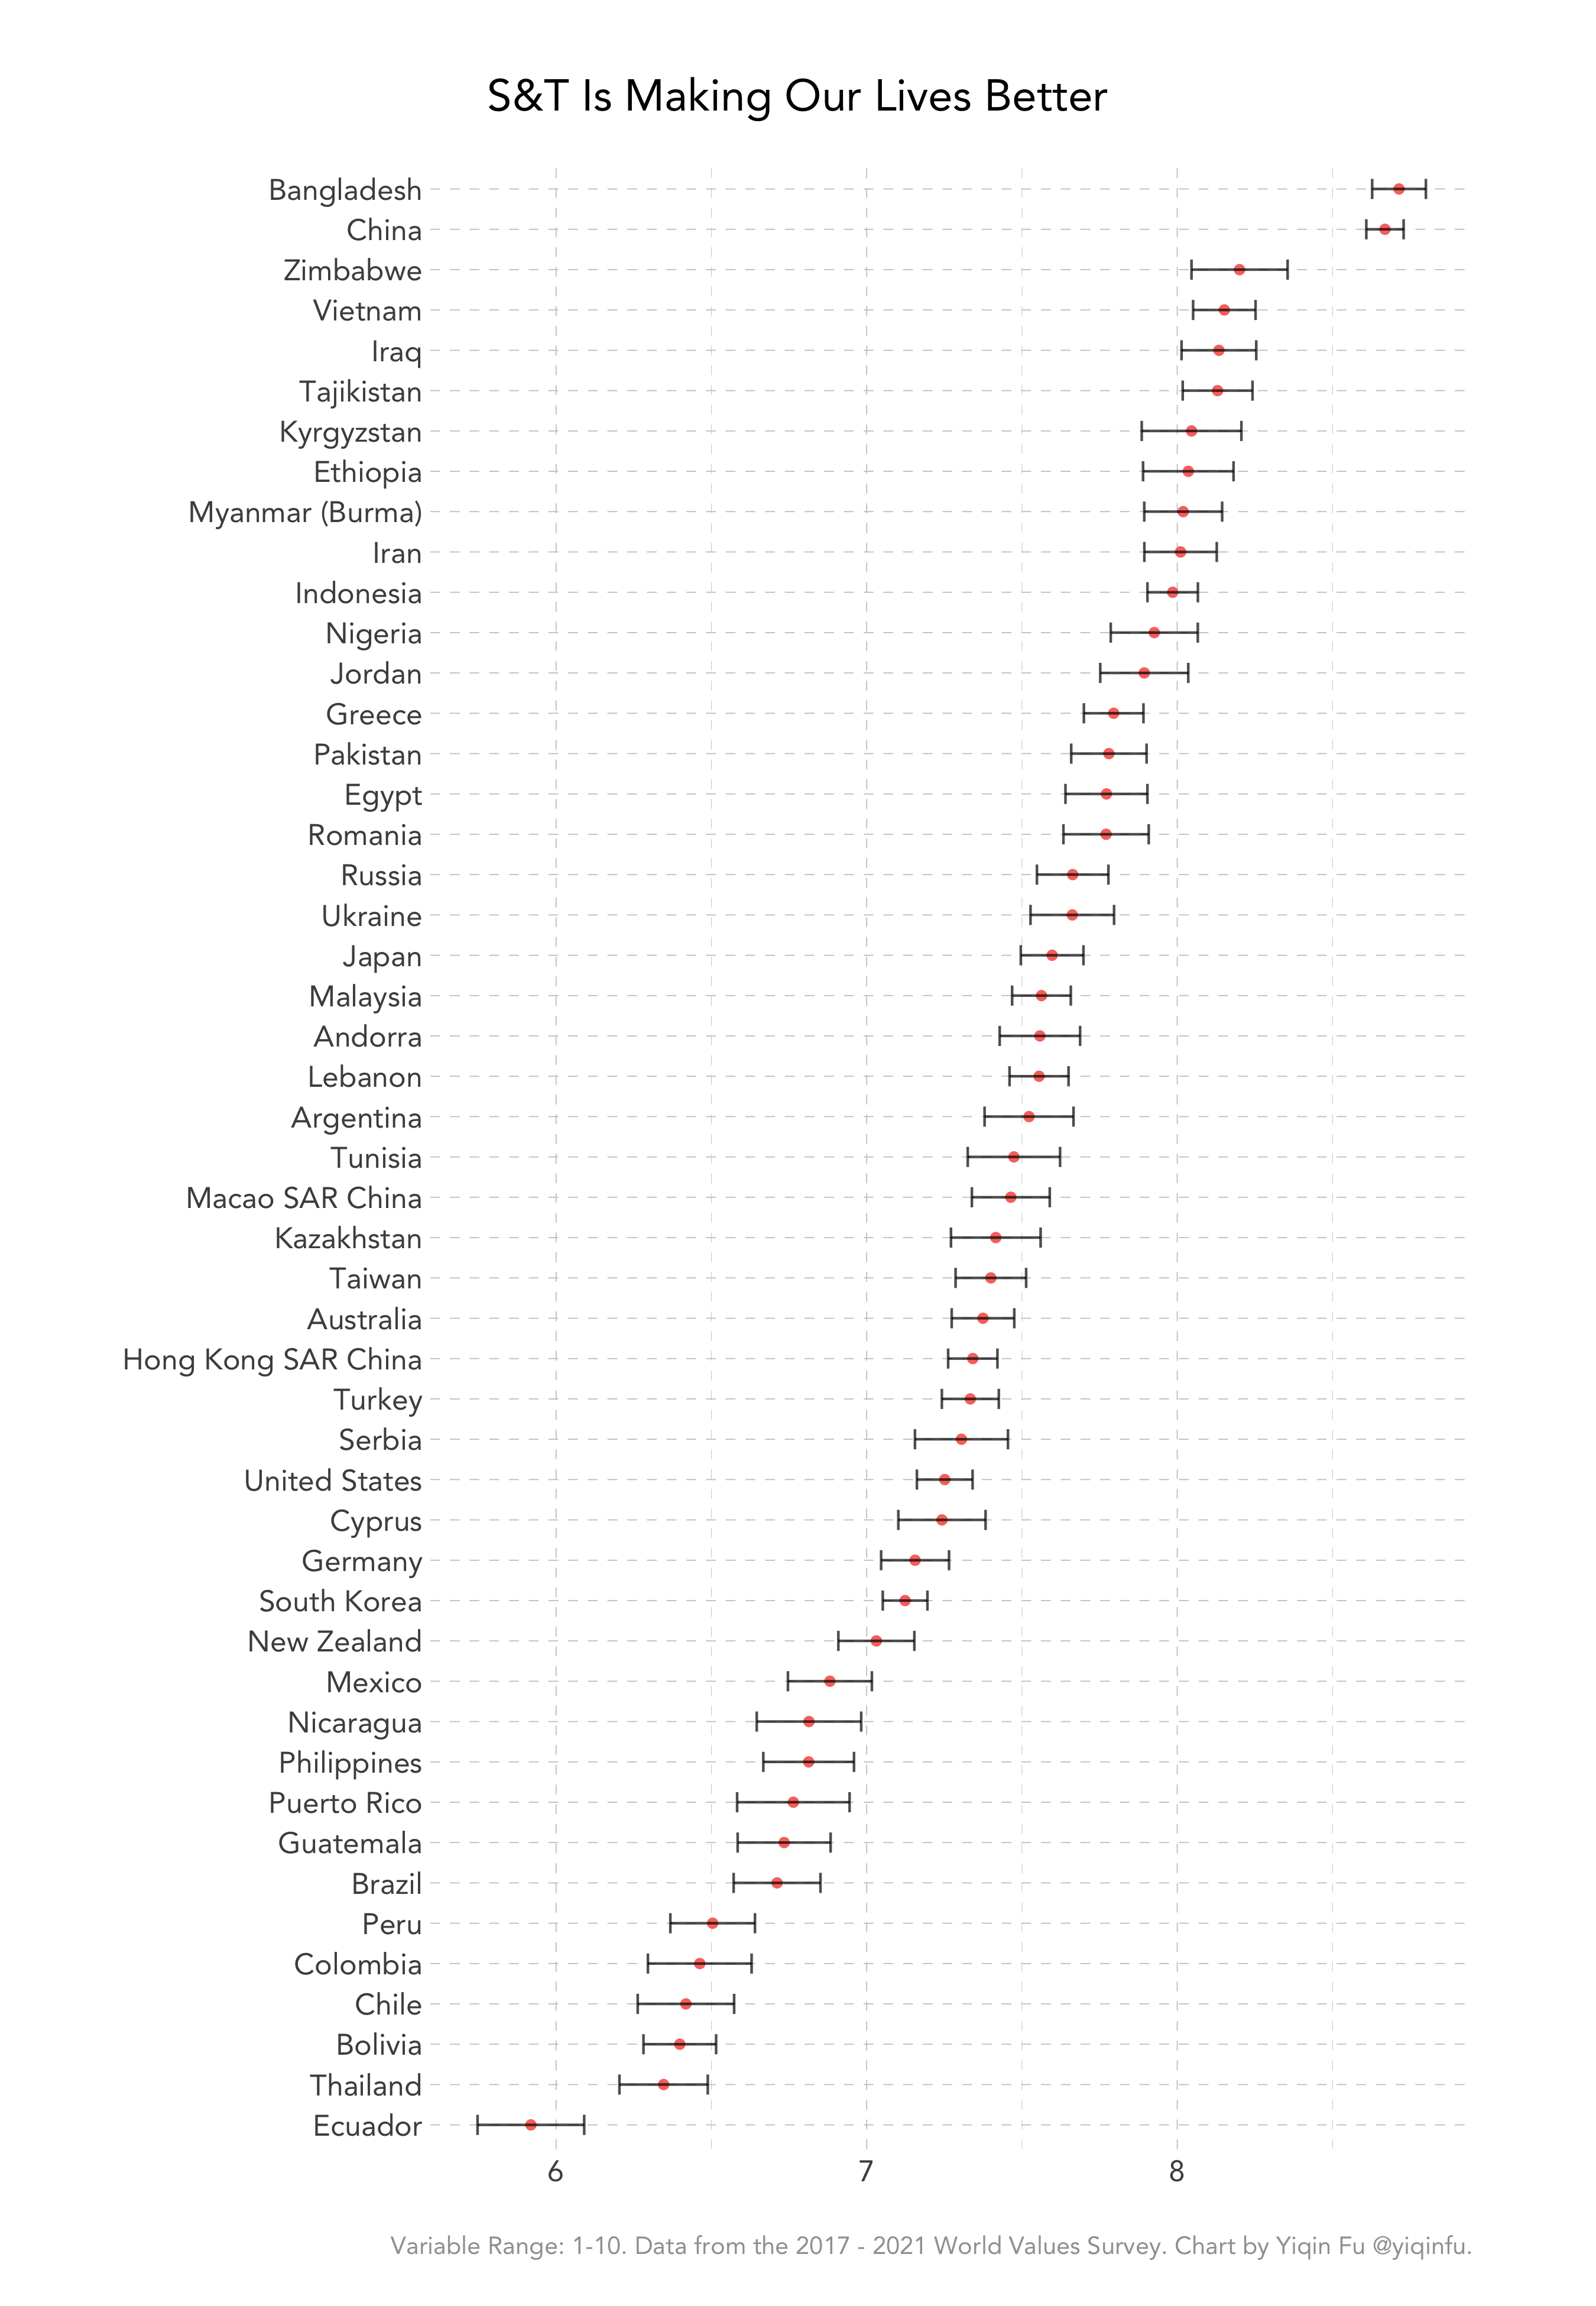
- Science and technology are making our lives healthier, easier, and more comfortable.
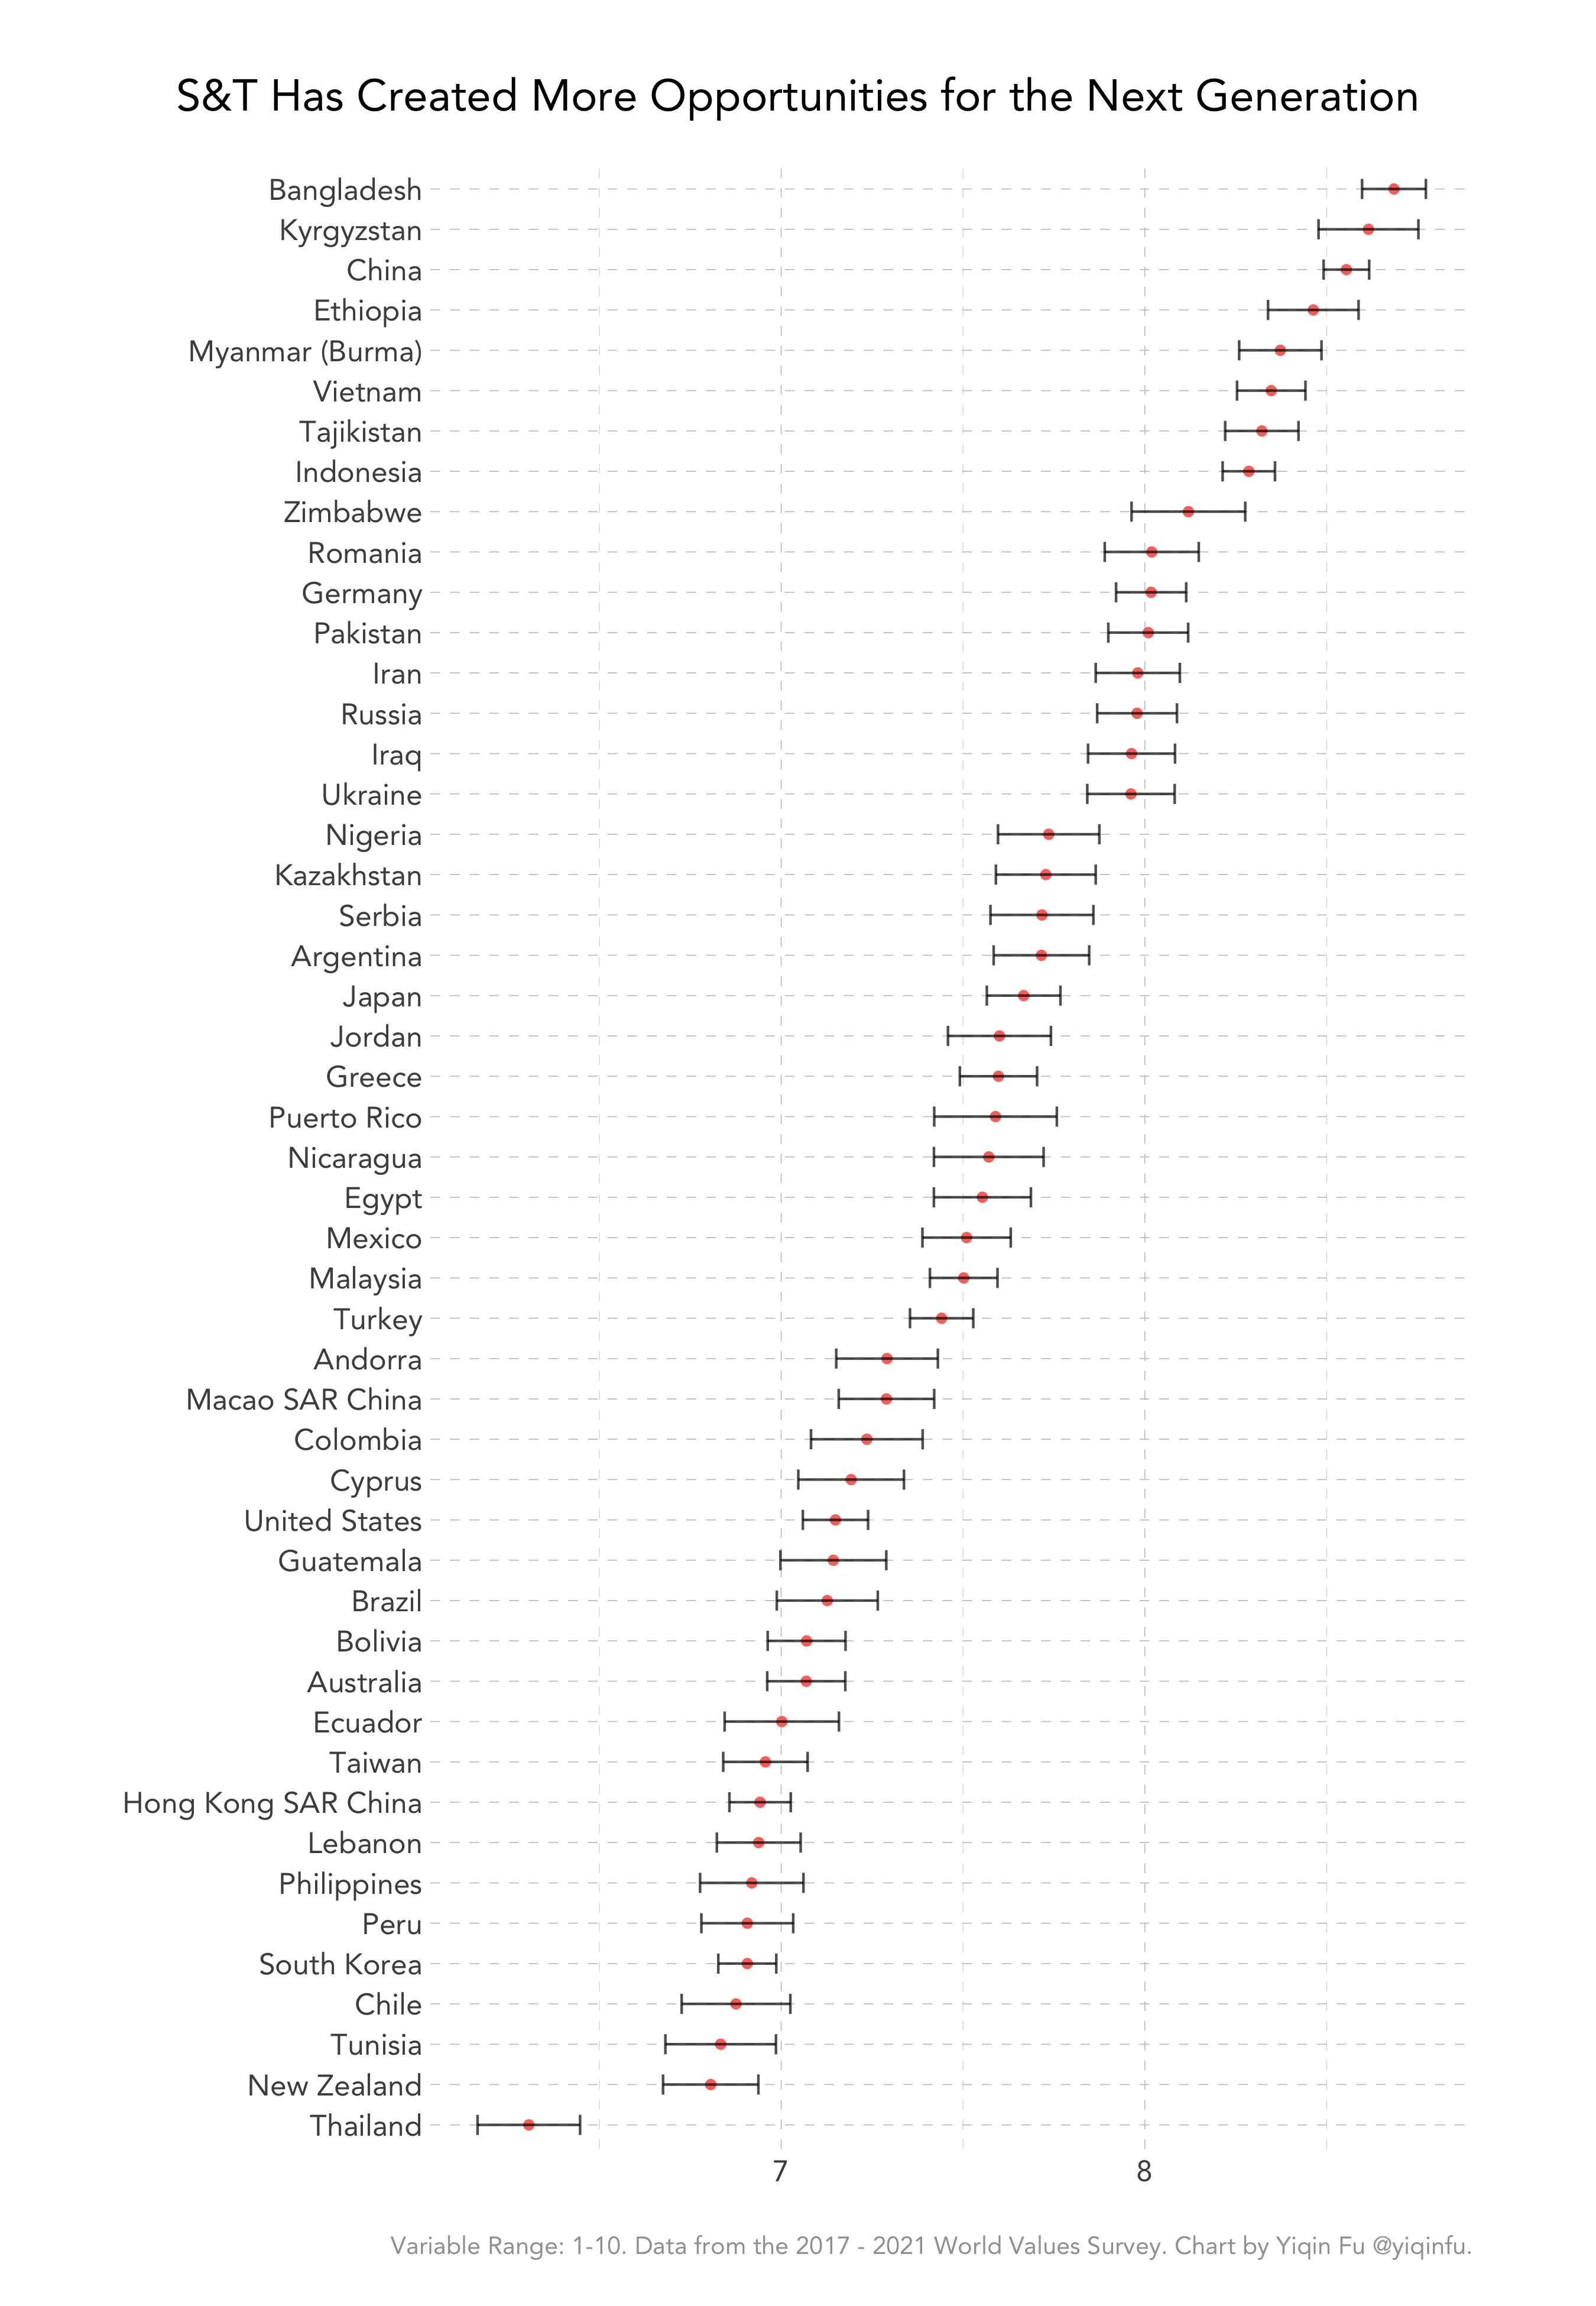
- Because of science and technology, there will be more opportunities for the next generation.
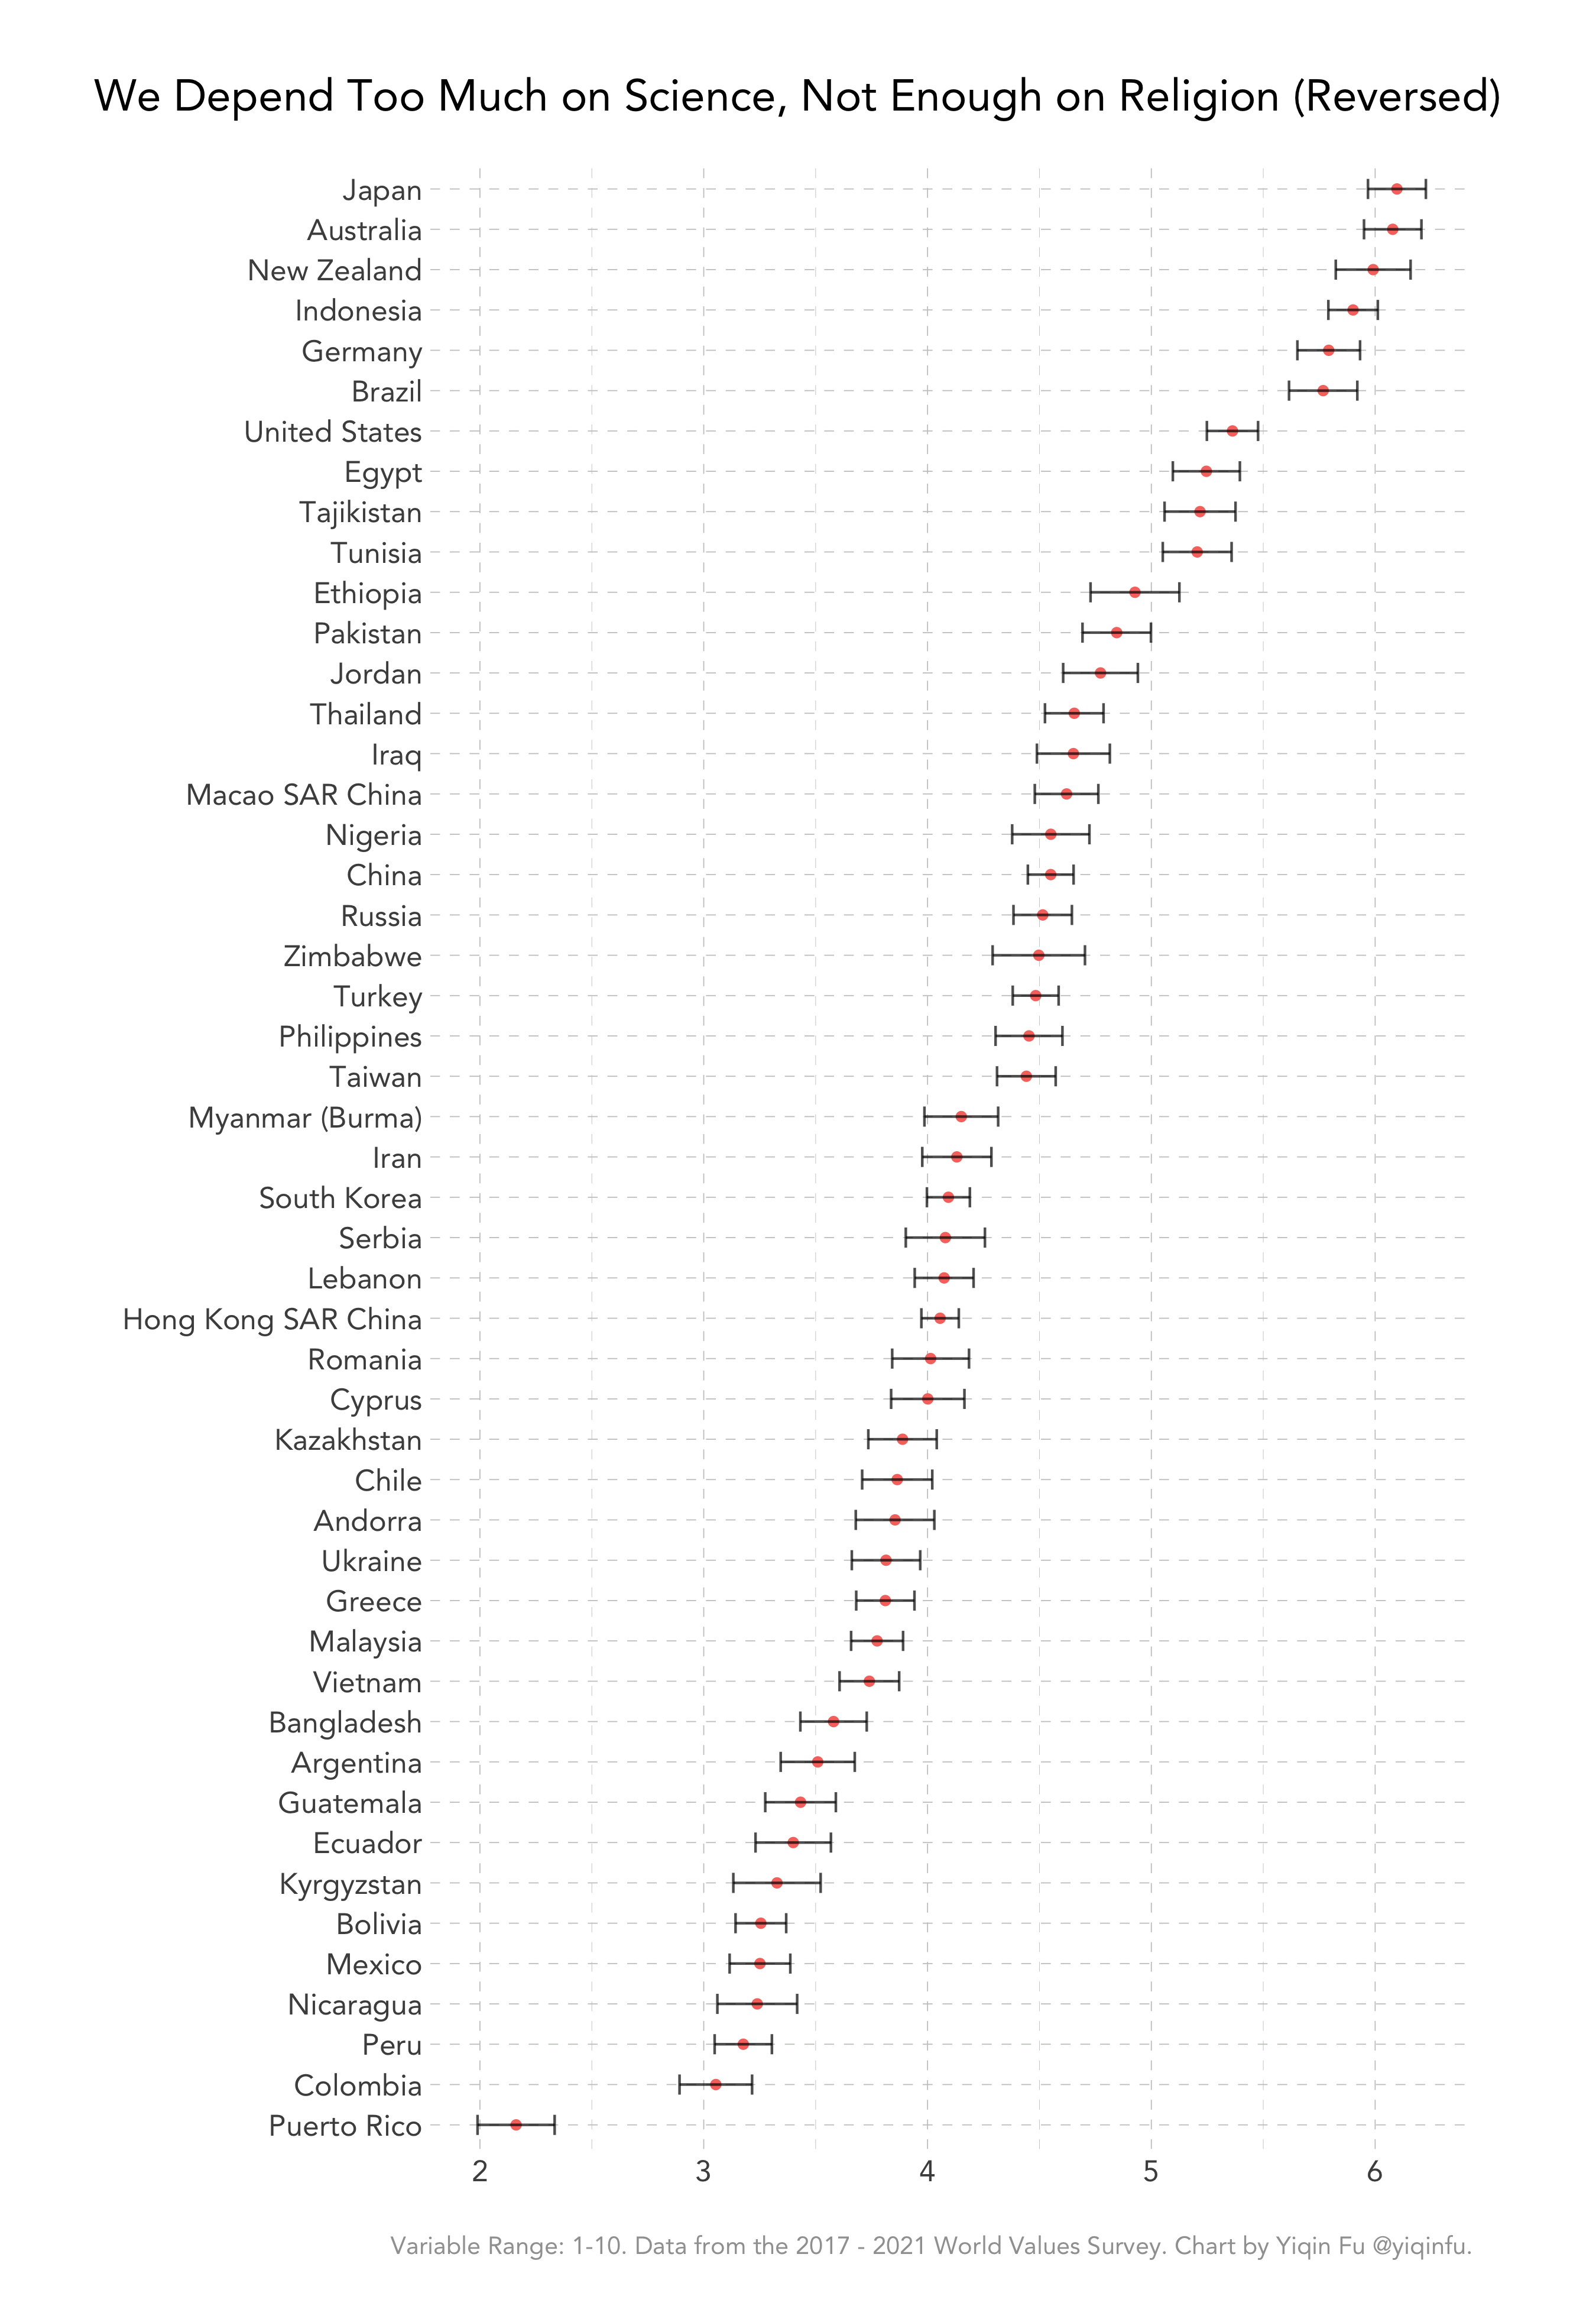
- We depend too much on science and not enough on faith. (reversed in the index)
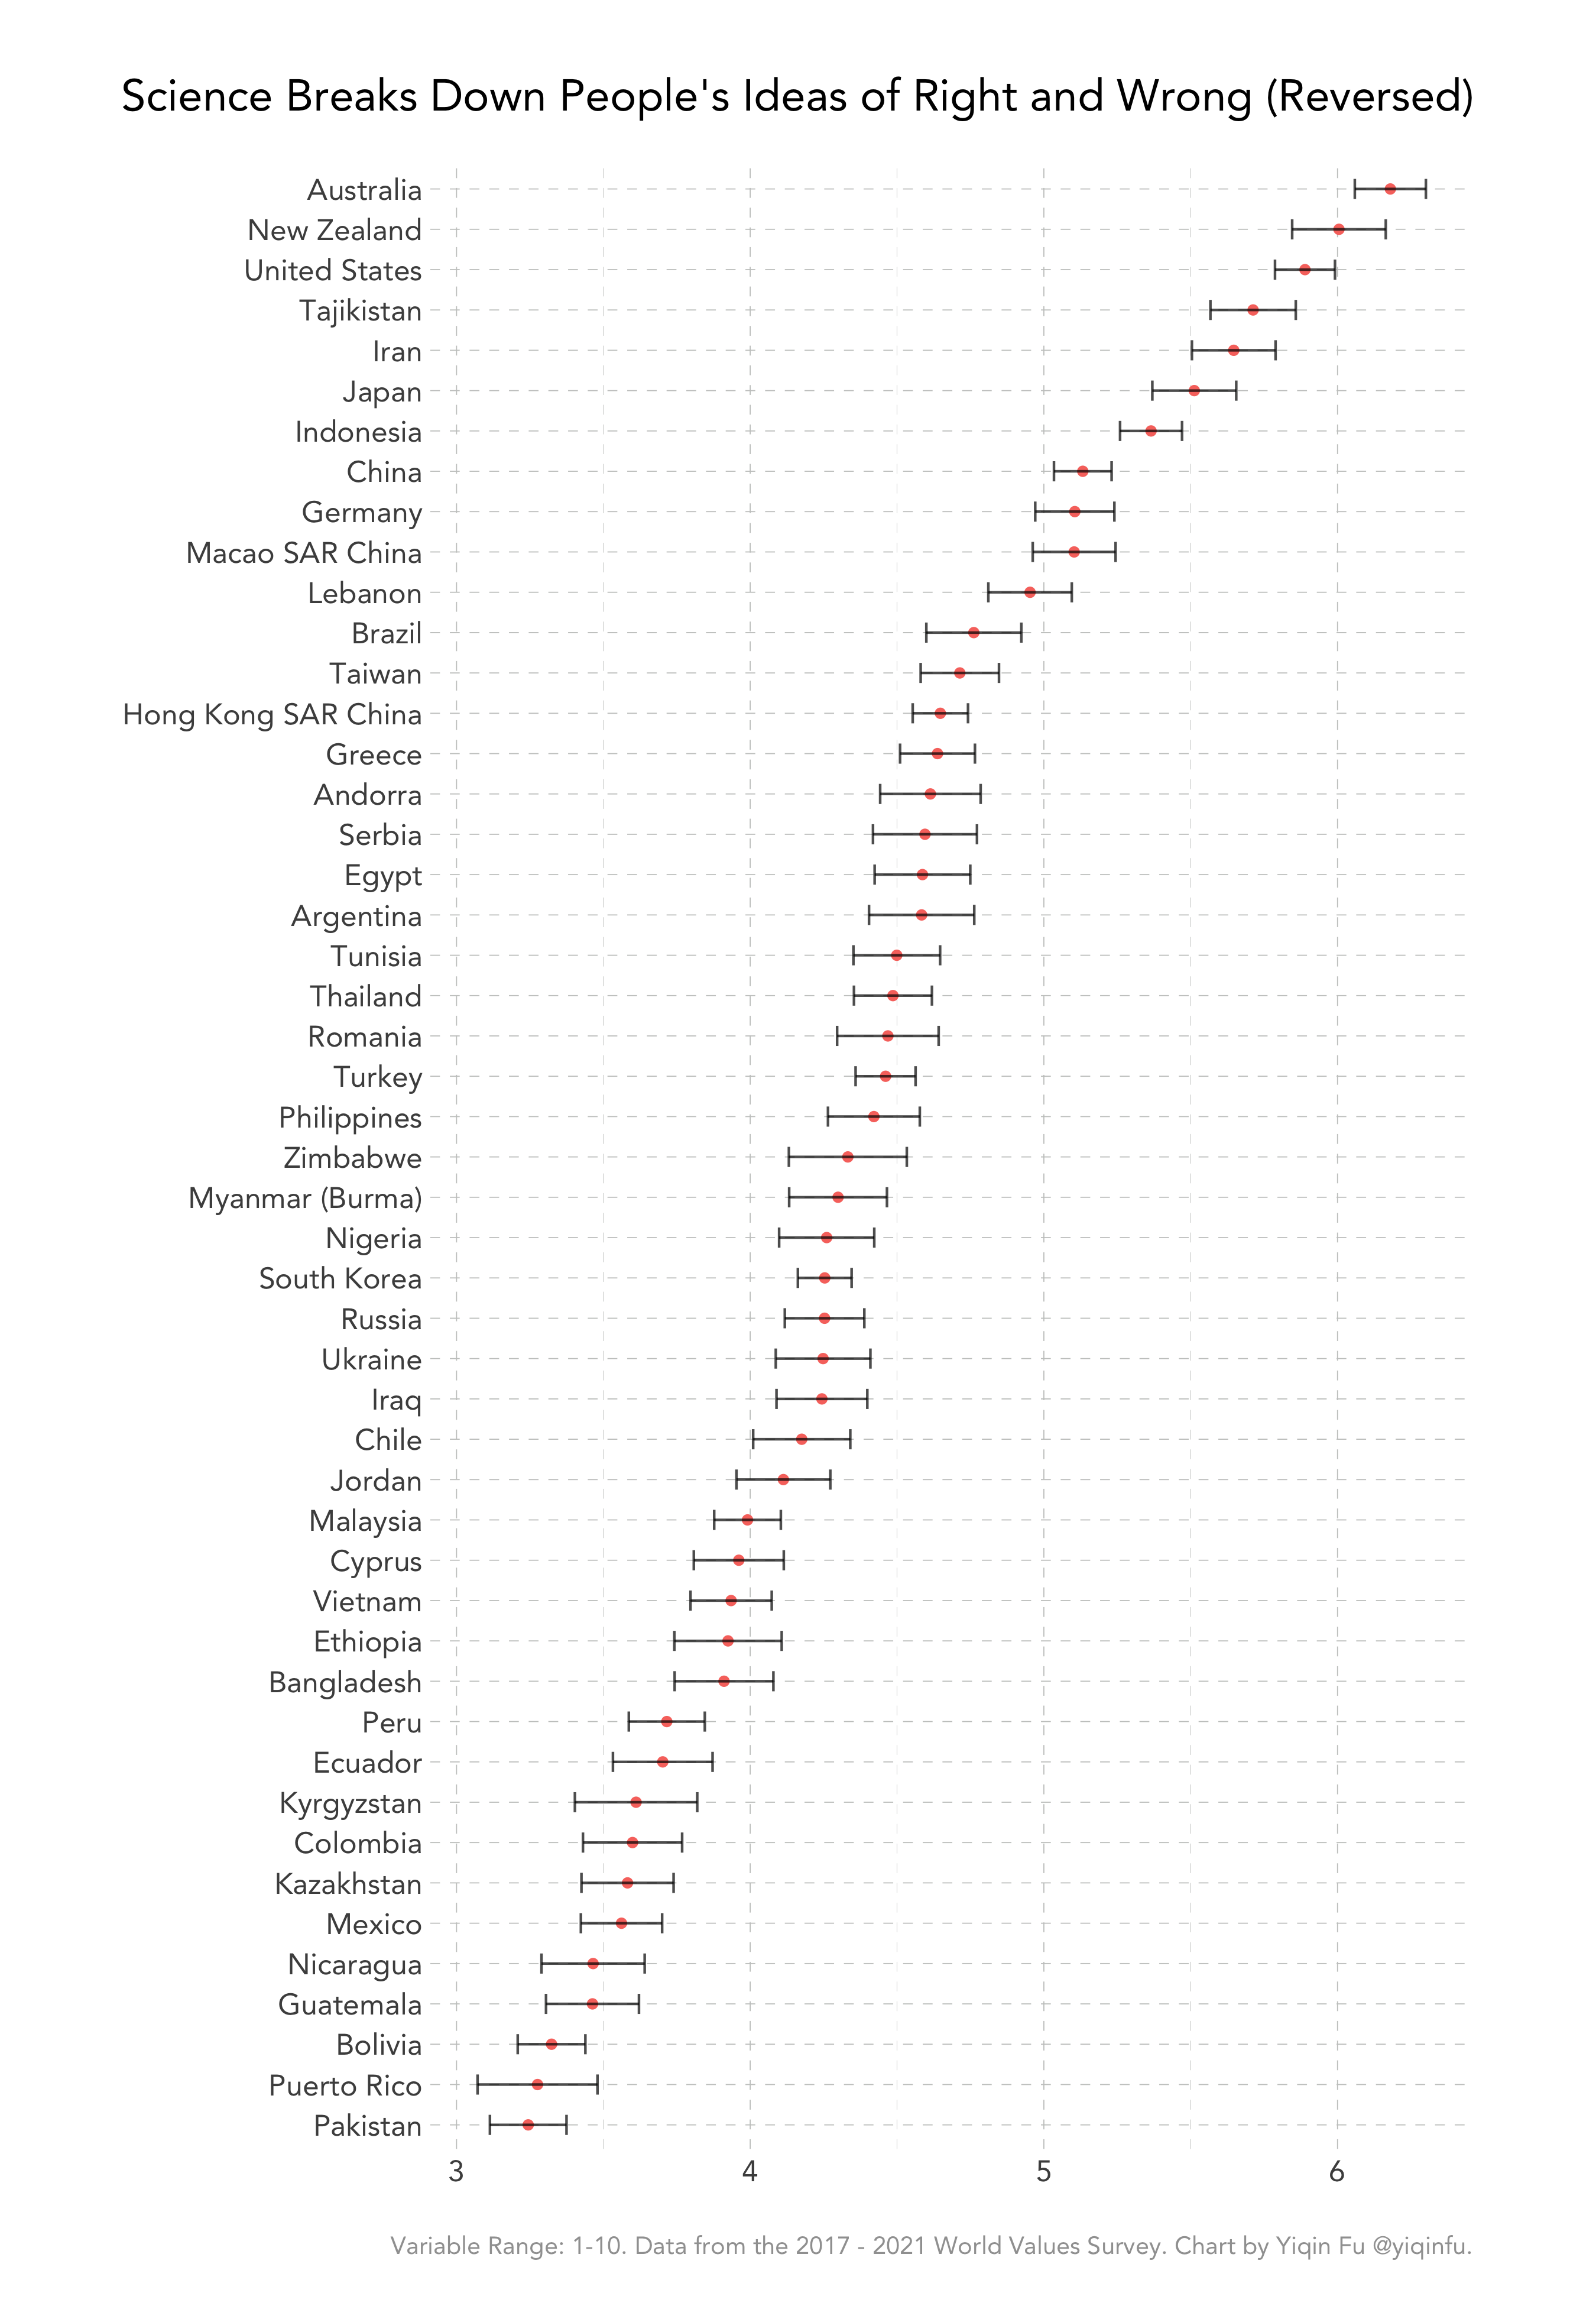
- One of the bad effects of science is that it breaks down people’s ideas of right and wrong. (reversed in the index)
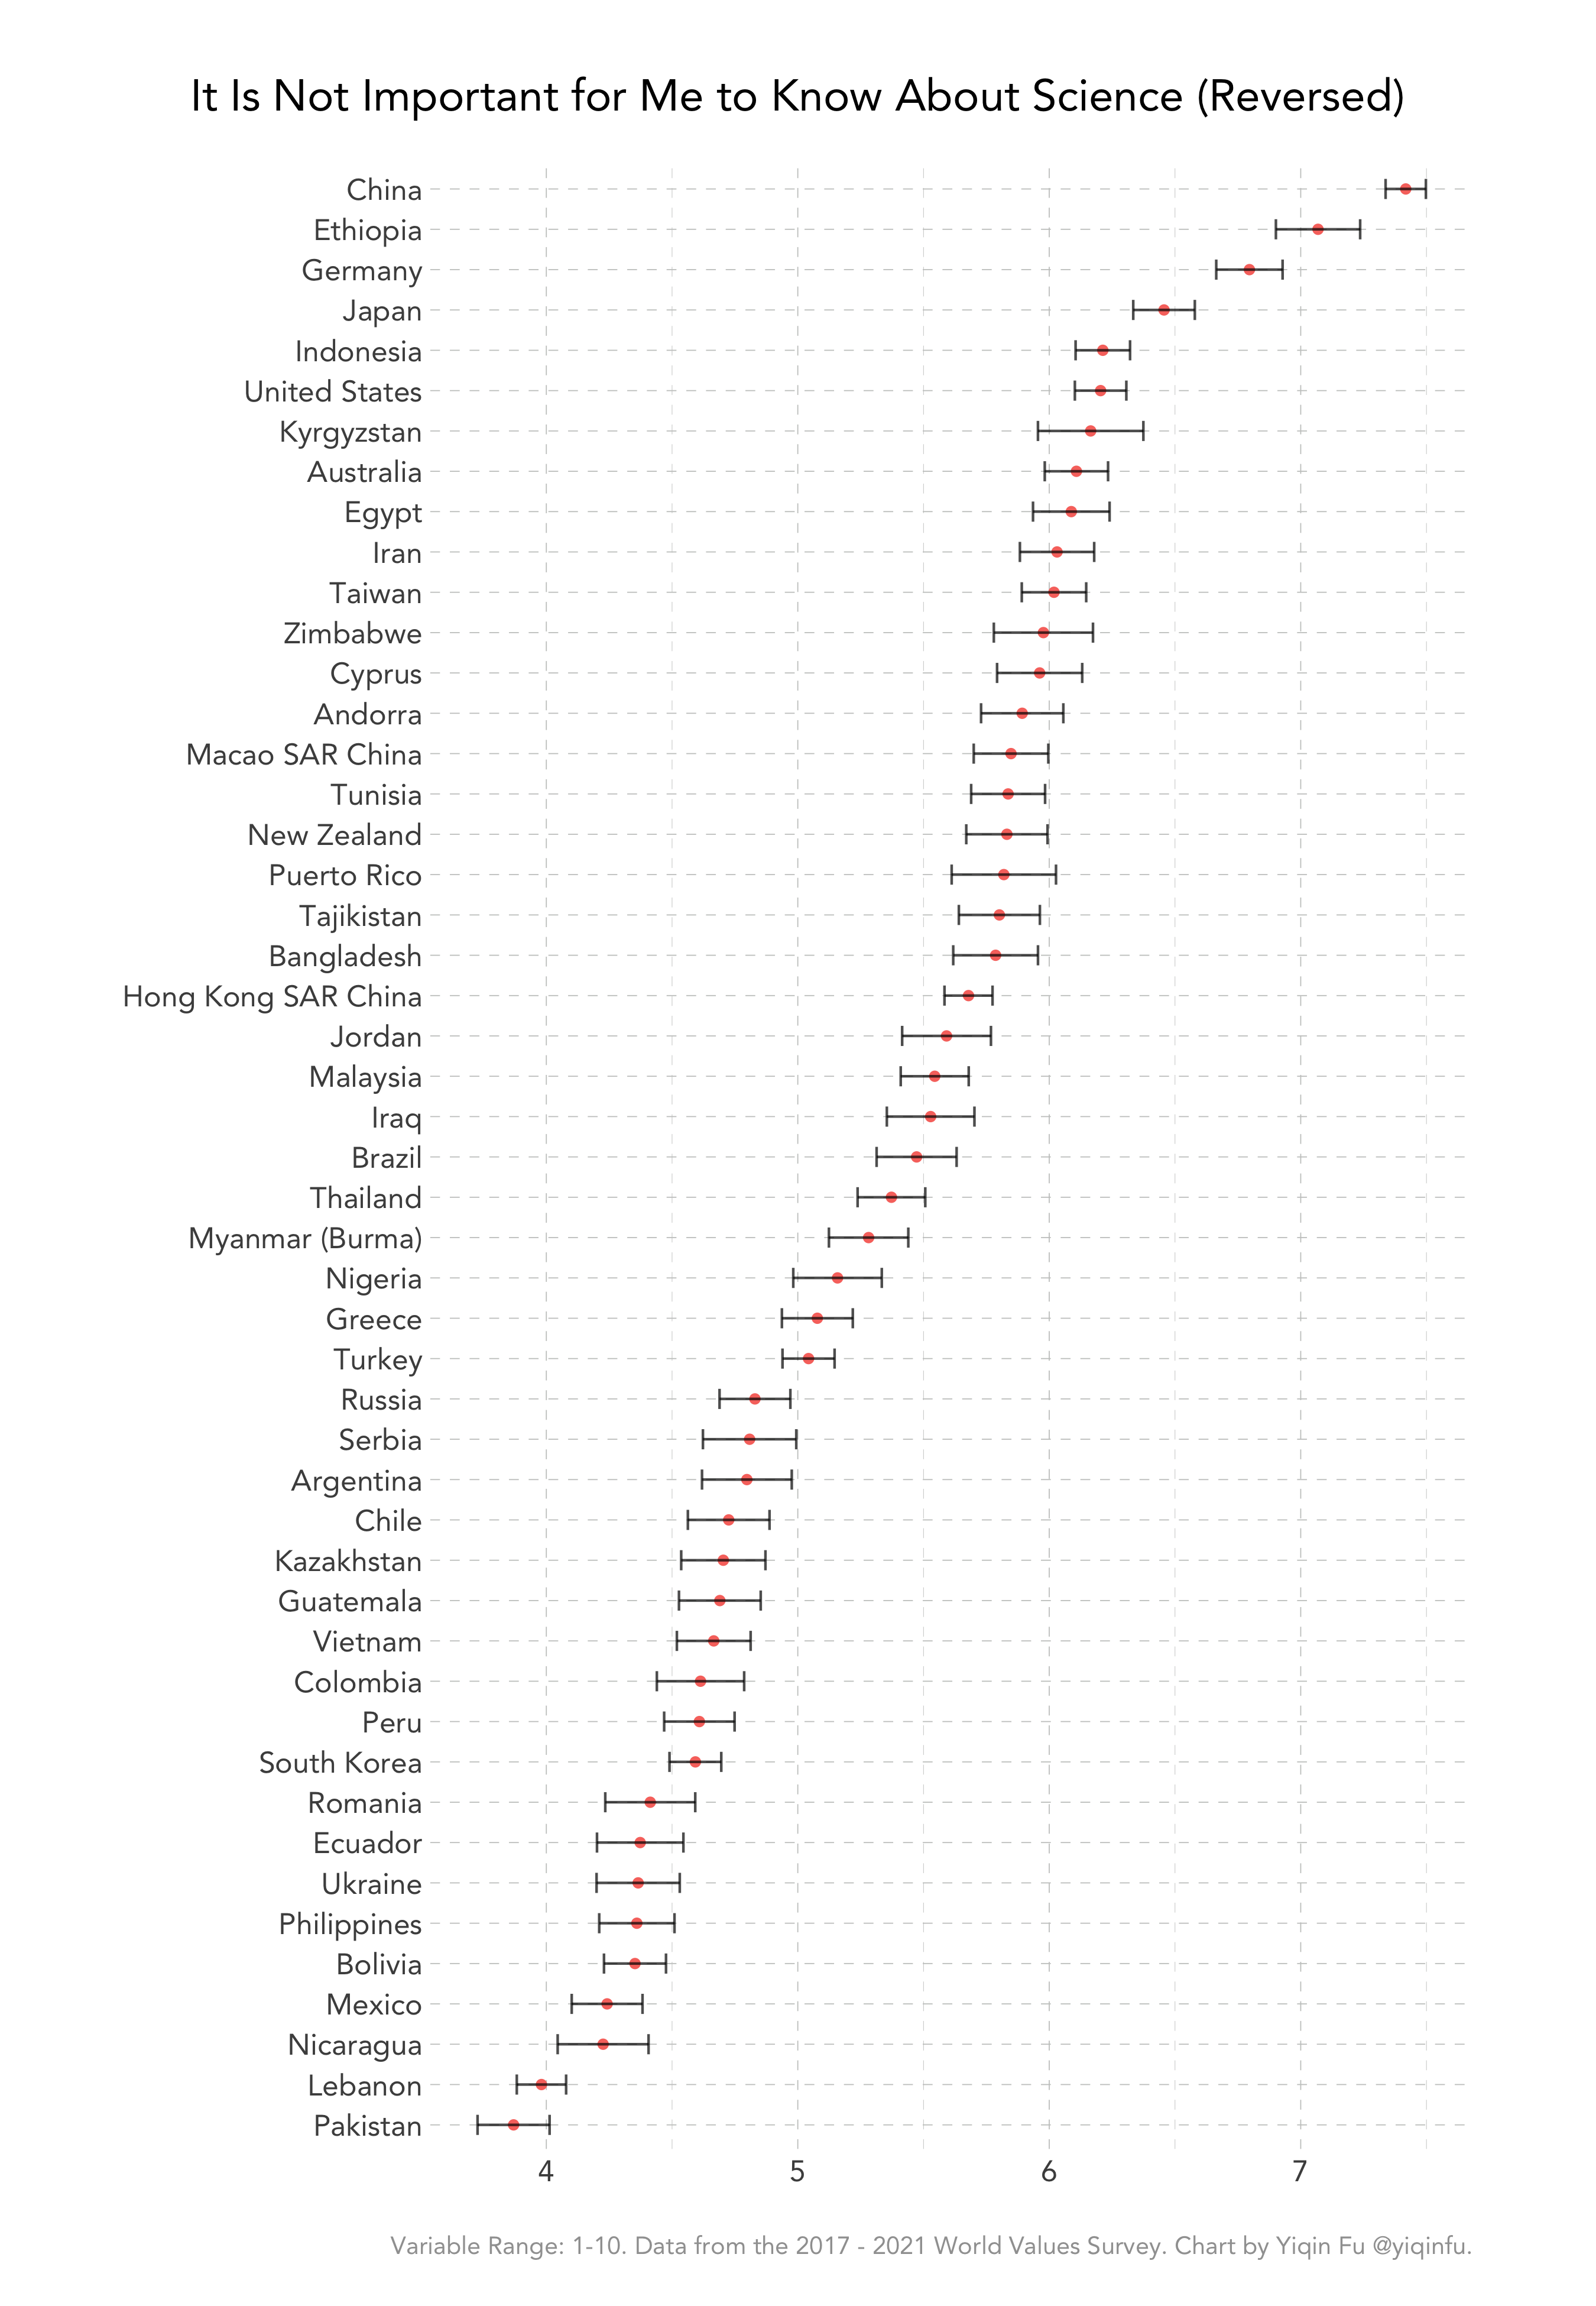
- It is not important for me to know about science in my daily life. (reversed in the index)
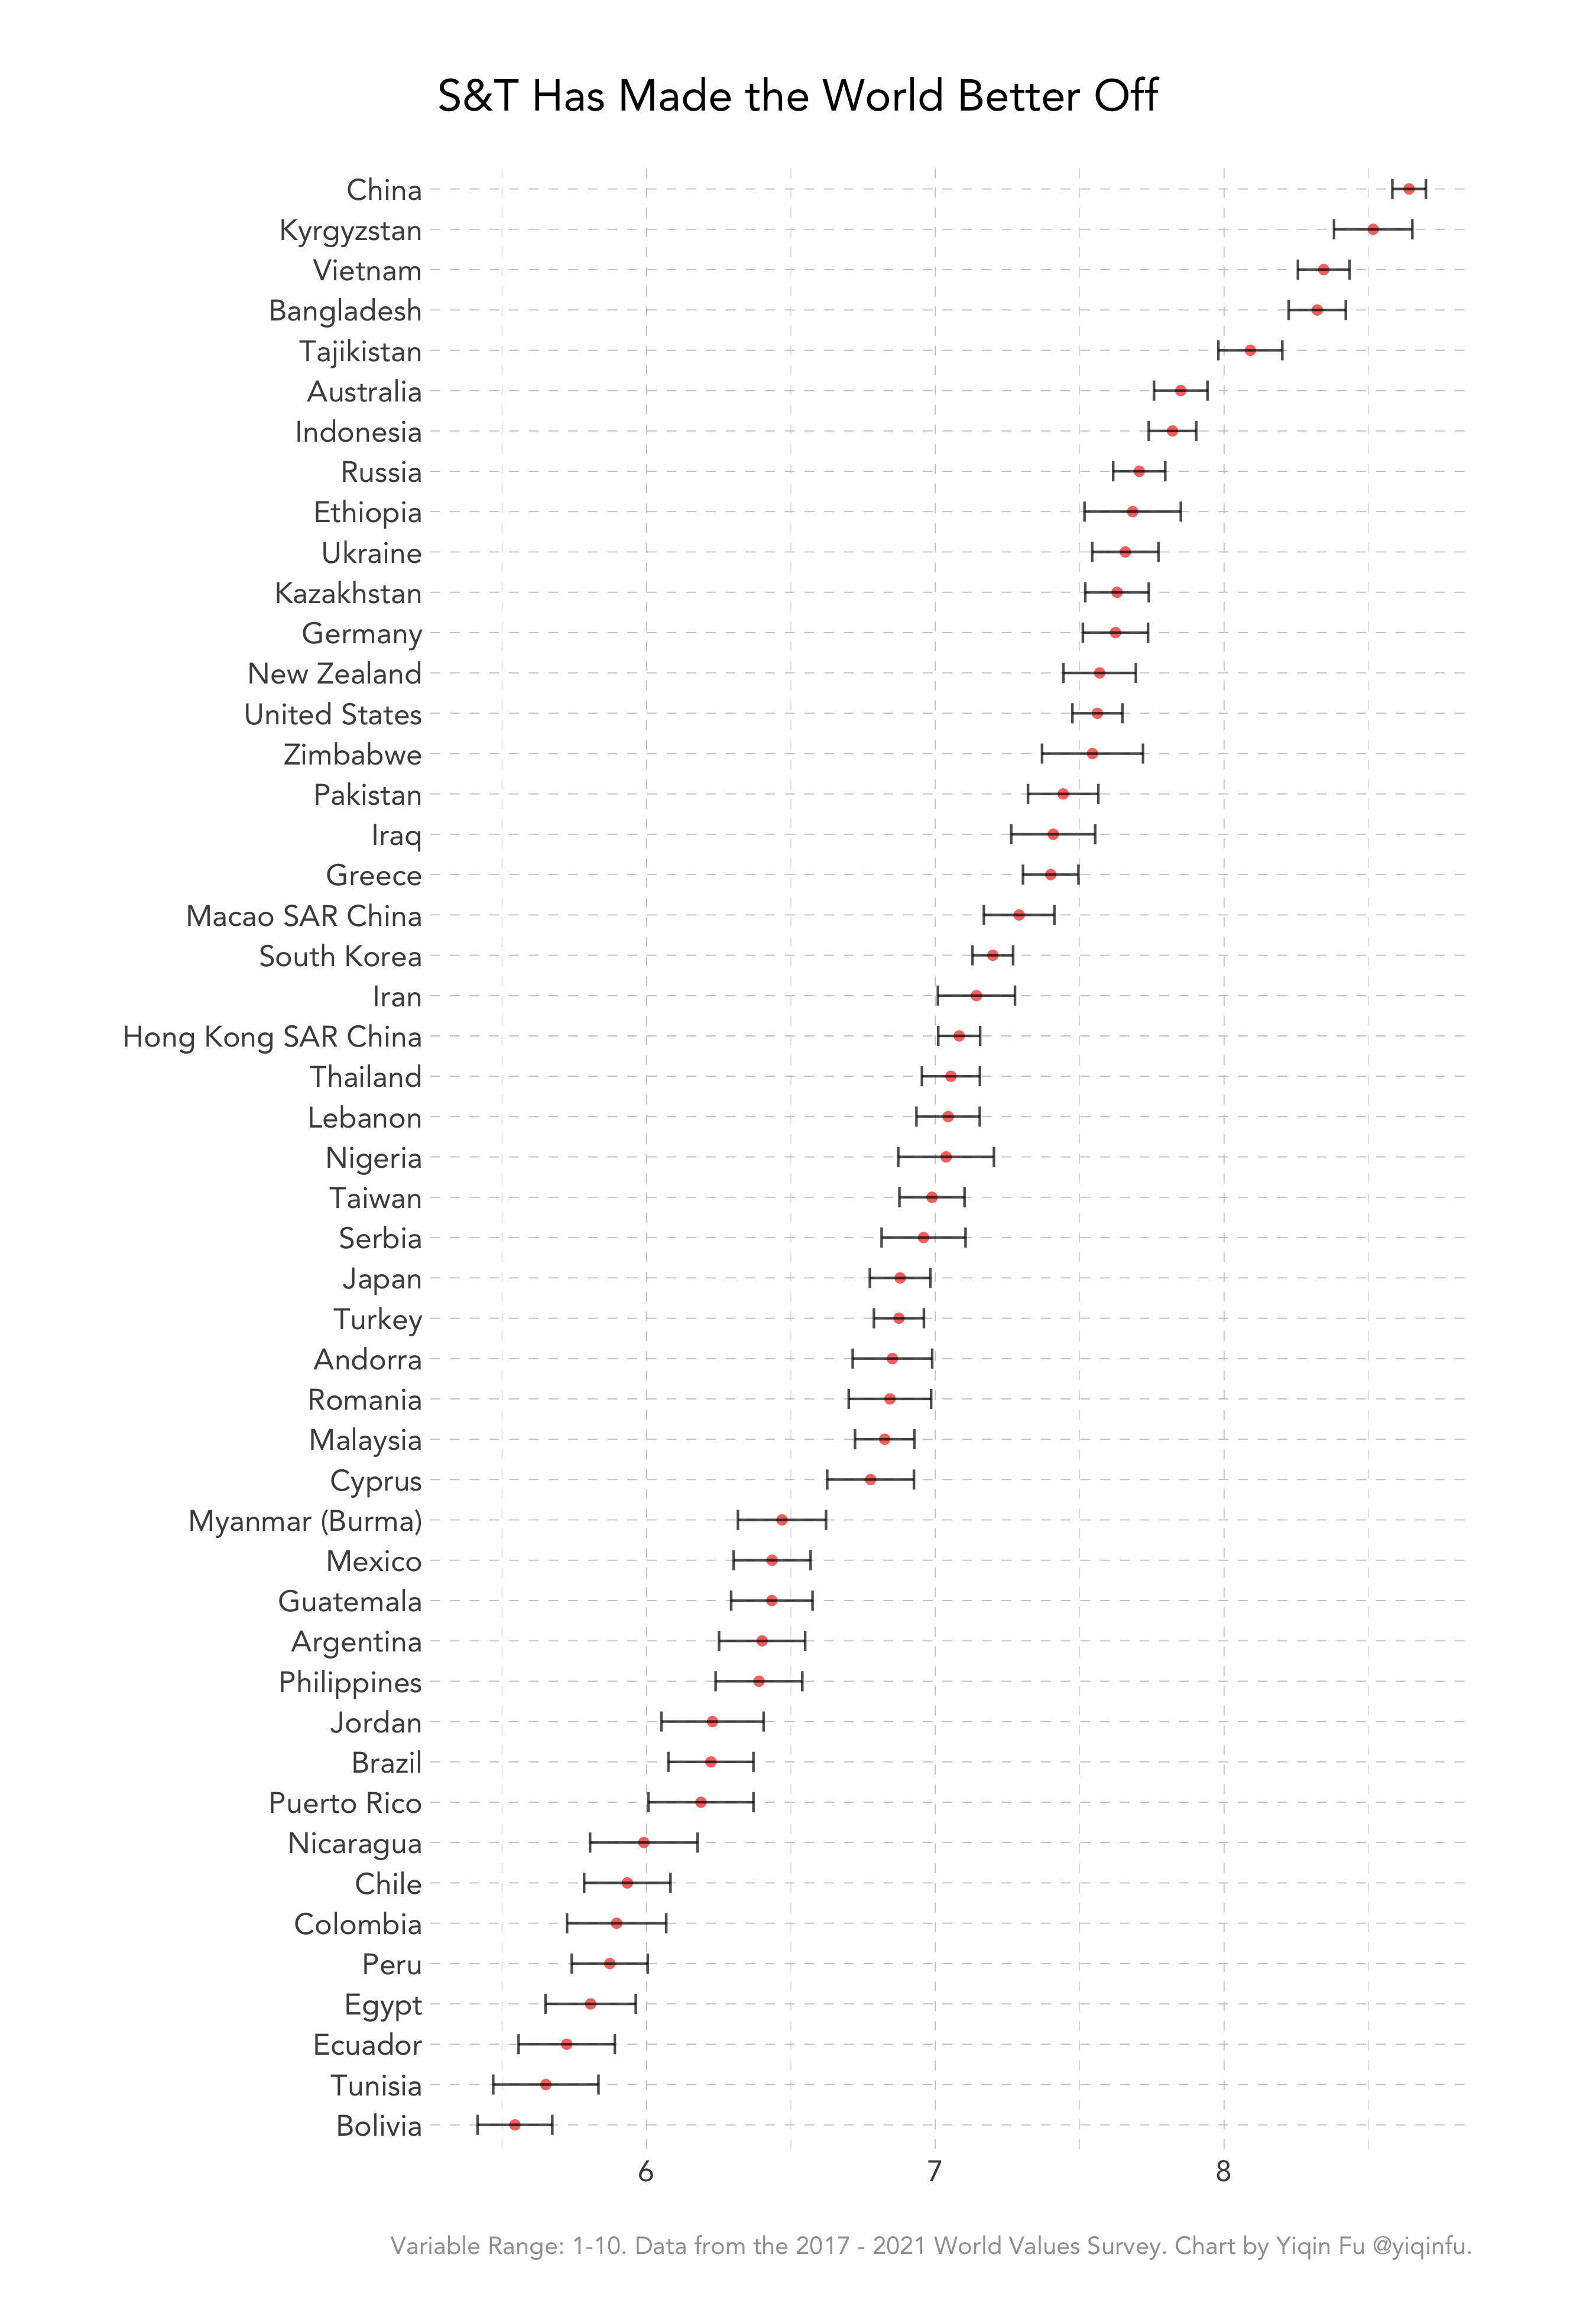
- All things considered, would you say that the world is better off, or worse off, because of science and technology?
GDP Growth and Attitudes Towards Science and Technology
At first glance, the composite measure seems correlated with economic growth. Is optimism in science and technology mostly capturing people’s experience of growth?
Below I plot per capita GDP growth in the past decade on the x-axis and the same “optimism in science and technology” on the y-axis.
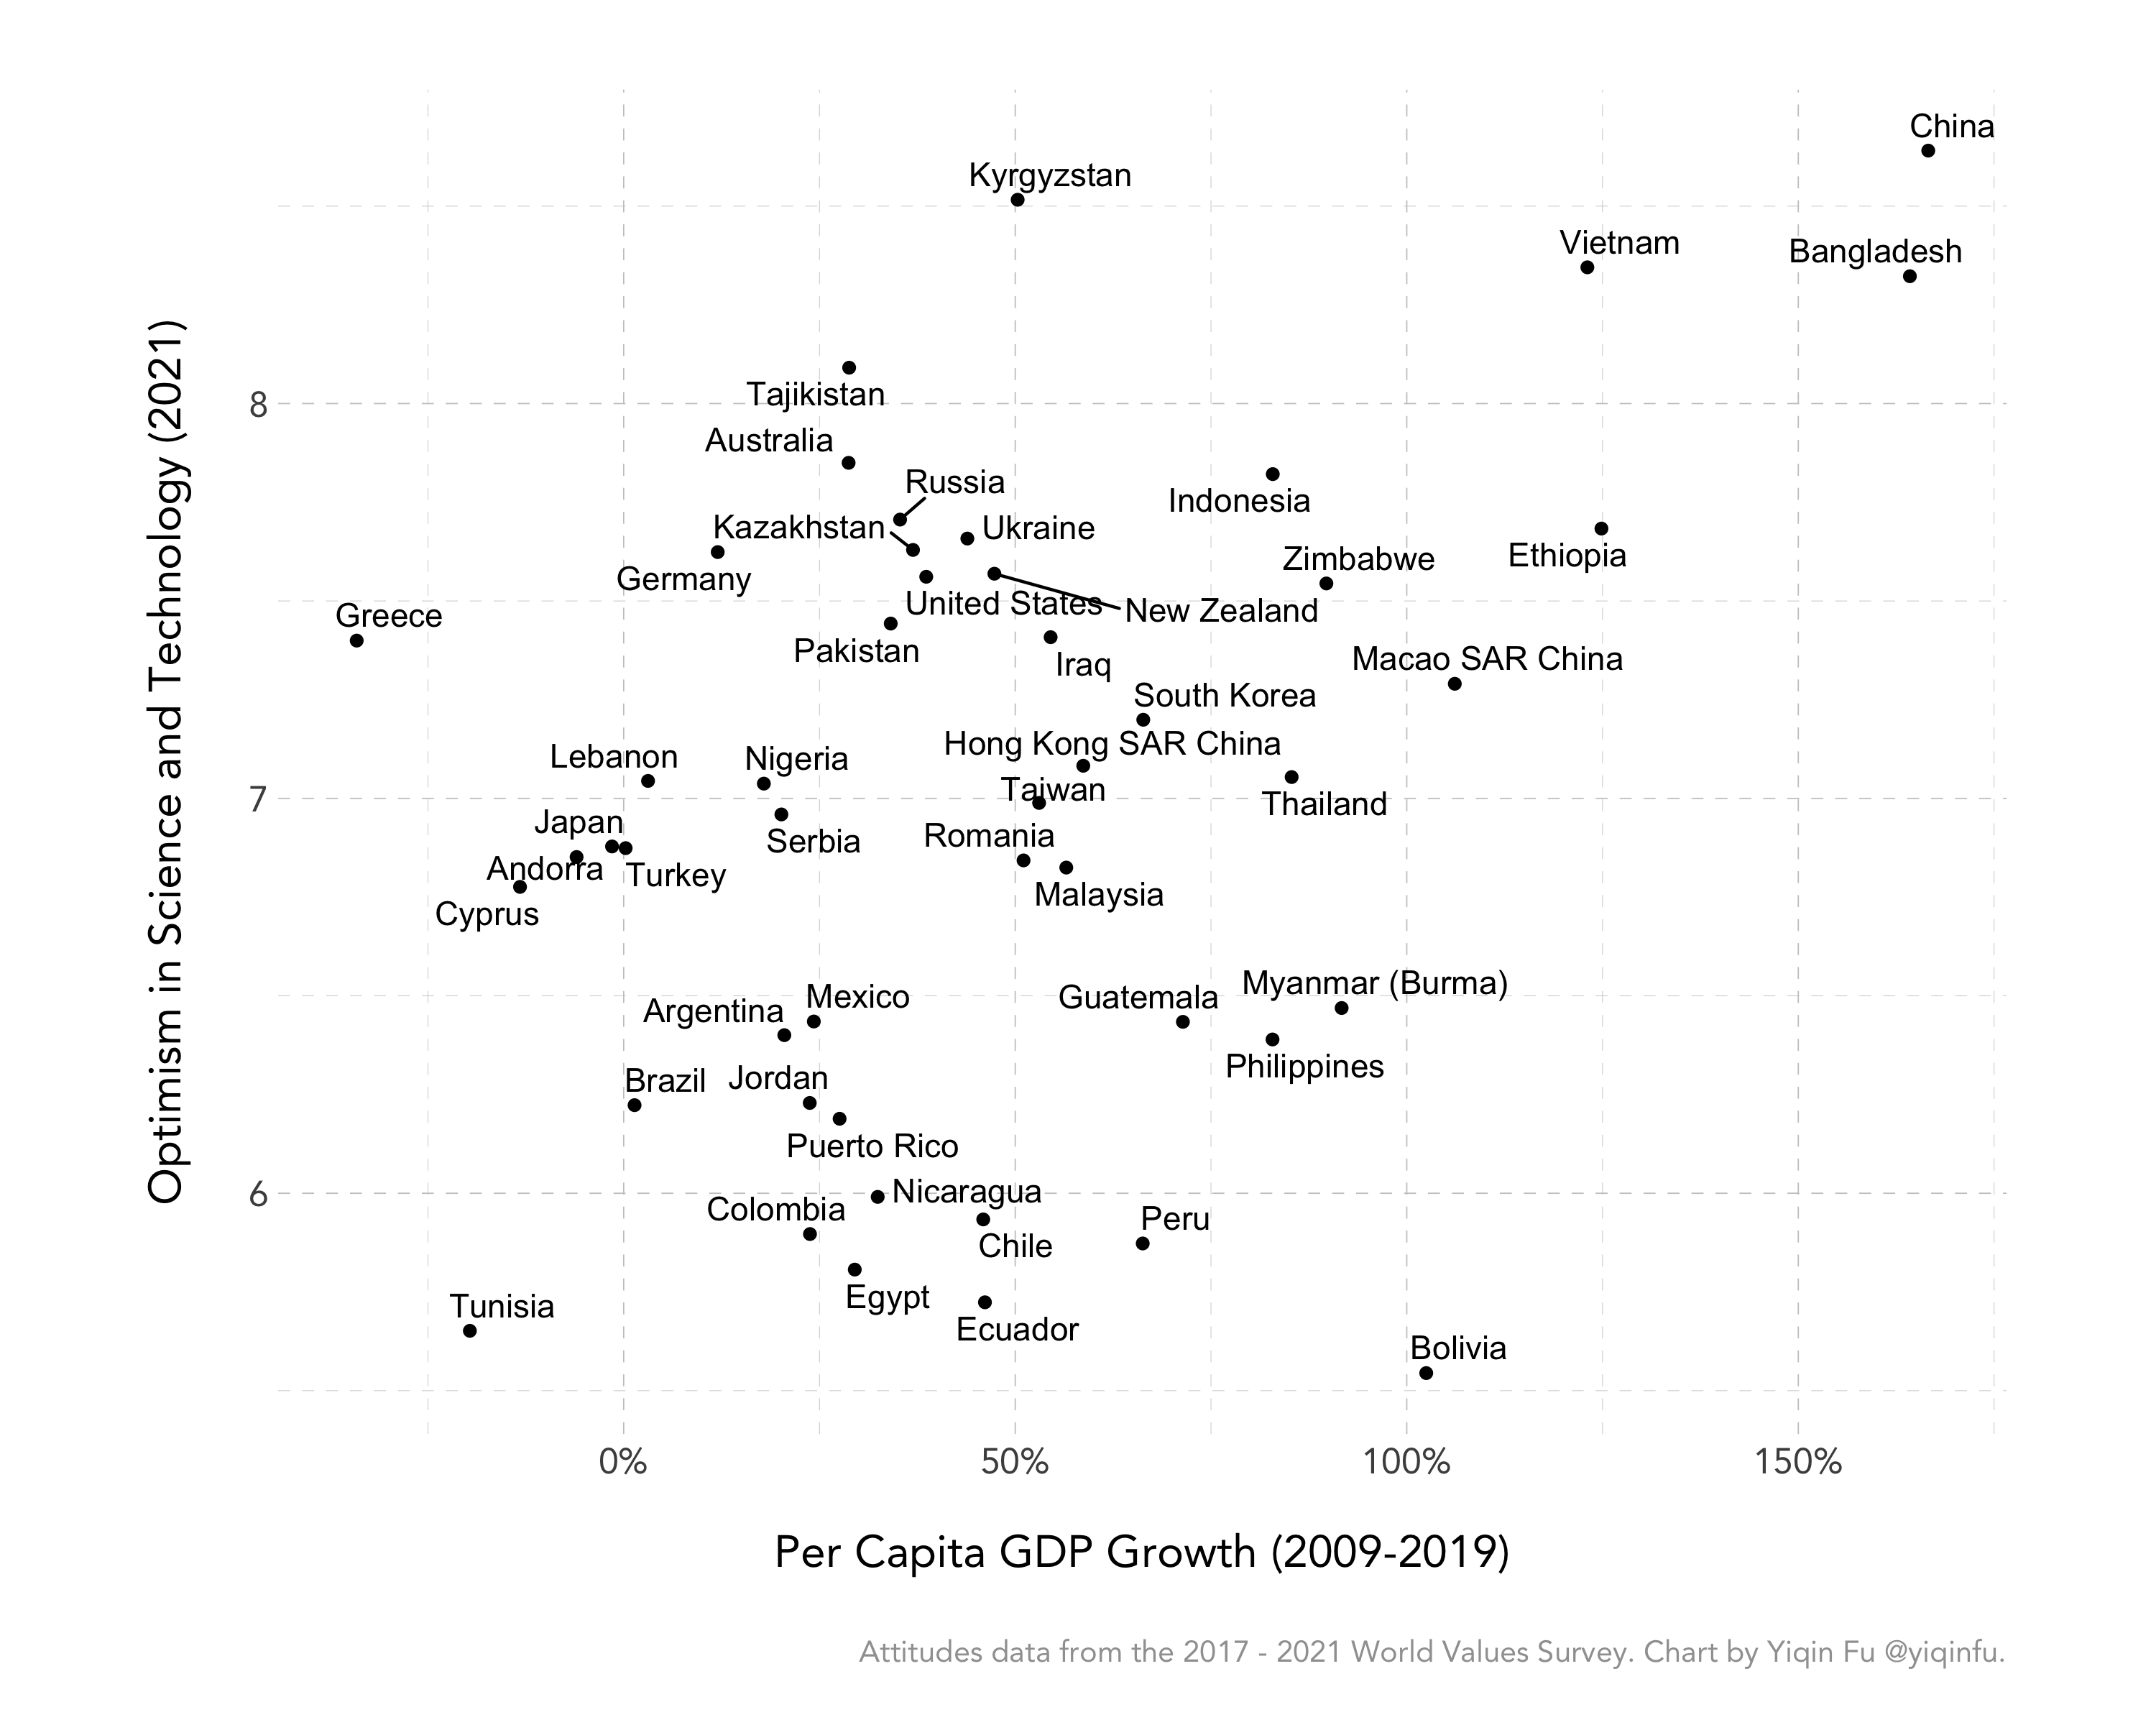
We see that there is a very weak relationship between the two aggregate variables. (R-squared = 0.03) Unfortunately, the World Values Survey doesn’t ask income or income growth in a way that makes the data comparable across countries, so we don’t know whether we observe this correlation between growth and optimism in science and technology at the individual level. (Aggregate-level patterns don’t necessarily translate into the individual level: Rich states vote Democratic, but rich people vote Republican.)
For full transparency, here are the country averages for each question of the index.
I didn’t have any expectations about which countries would come on top, so I was surprised to see China, Bangladesh, Krygyzstan, and Ethiopia high on this list.
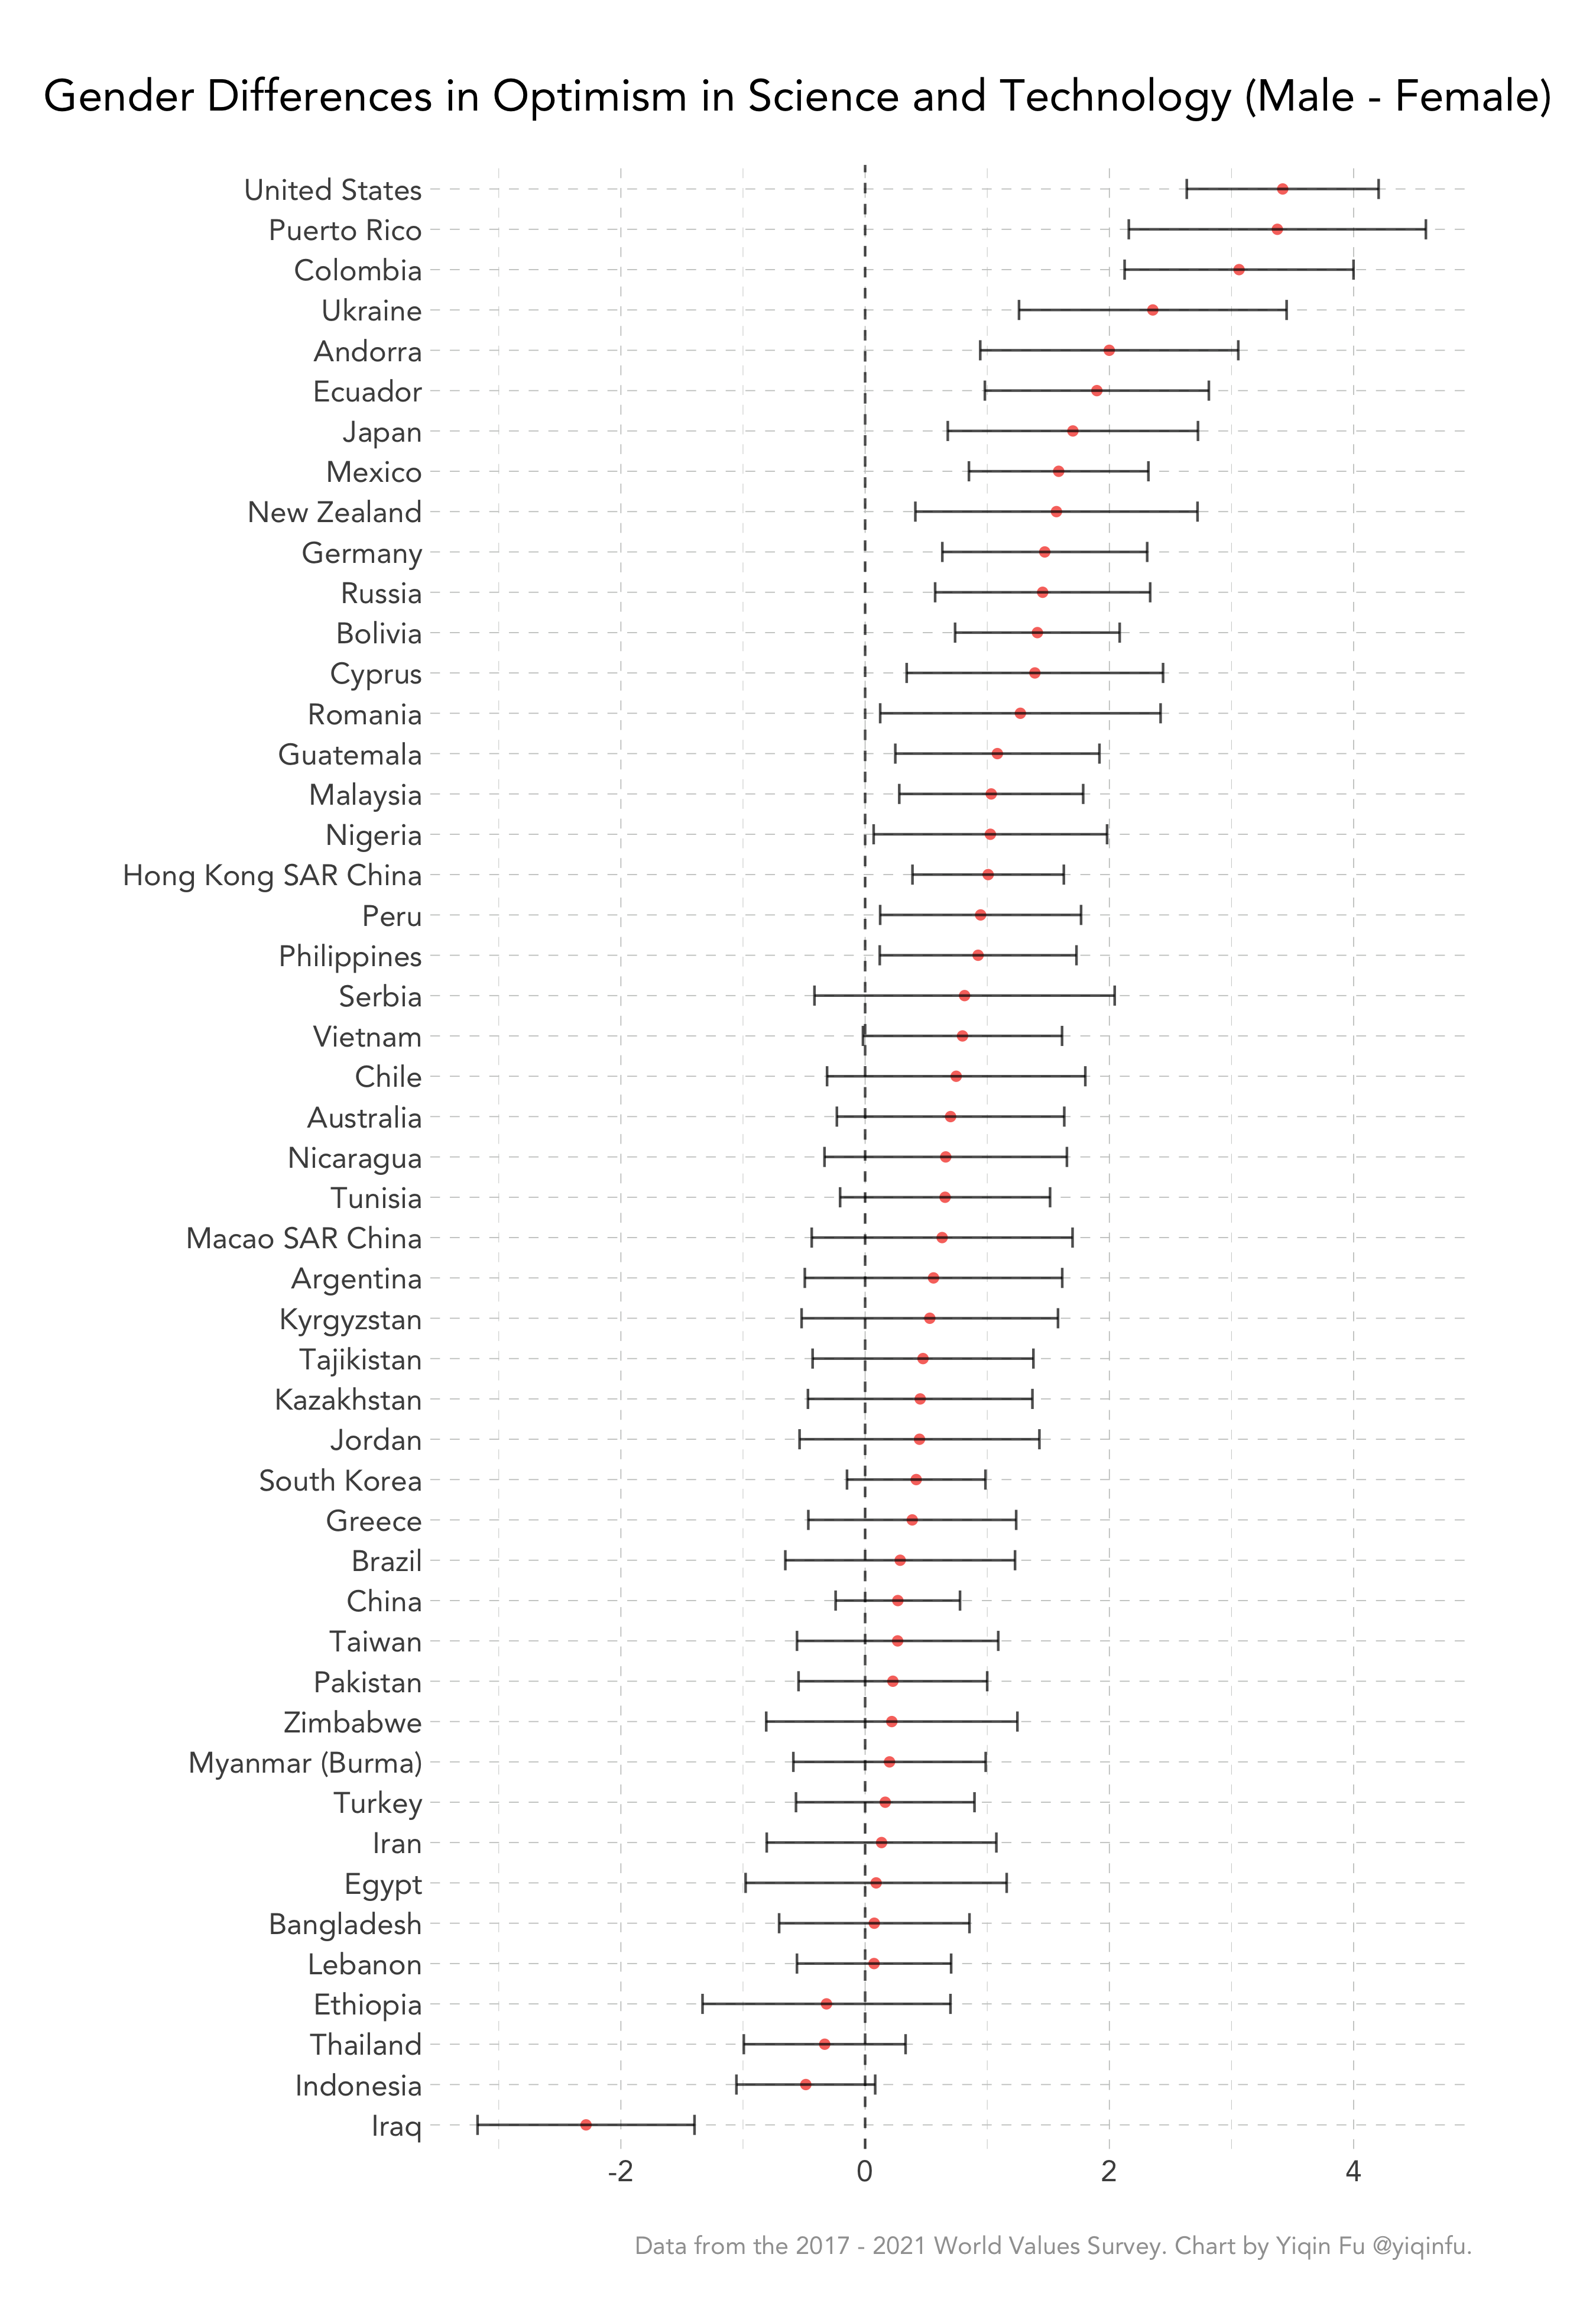
Gender Differences in Attitudes
Last, we turn to gender differences in attitudes. For the composite index, 21 countries have differences significantly different from zero. The developed countries and regions include: the U.S., Puerto Rico, Andorra, Japan, New Zealand, Germany, and Hong Kong.
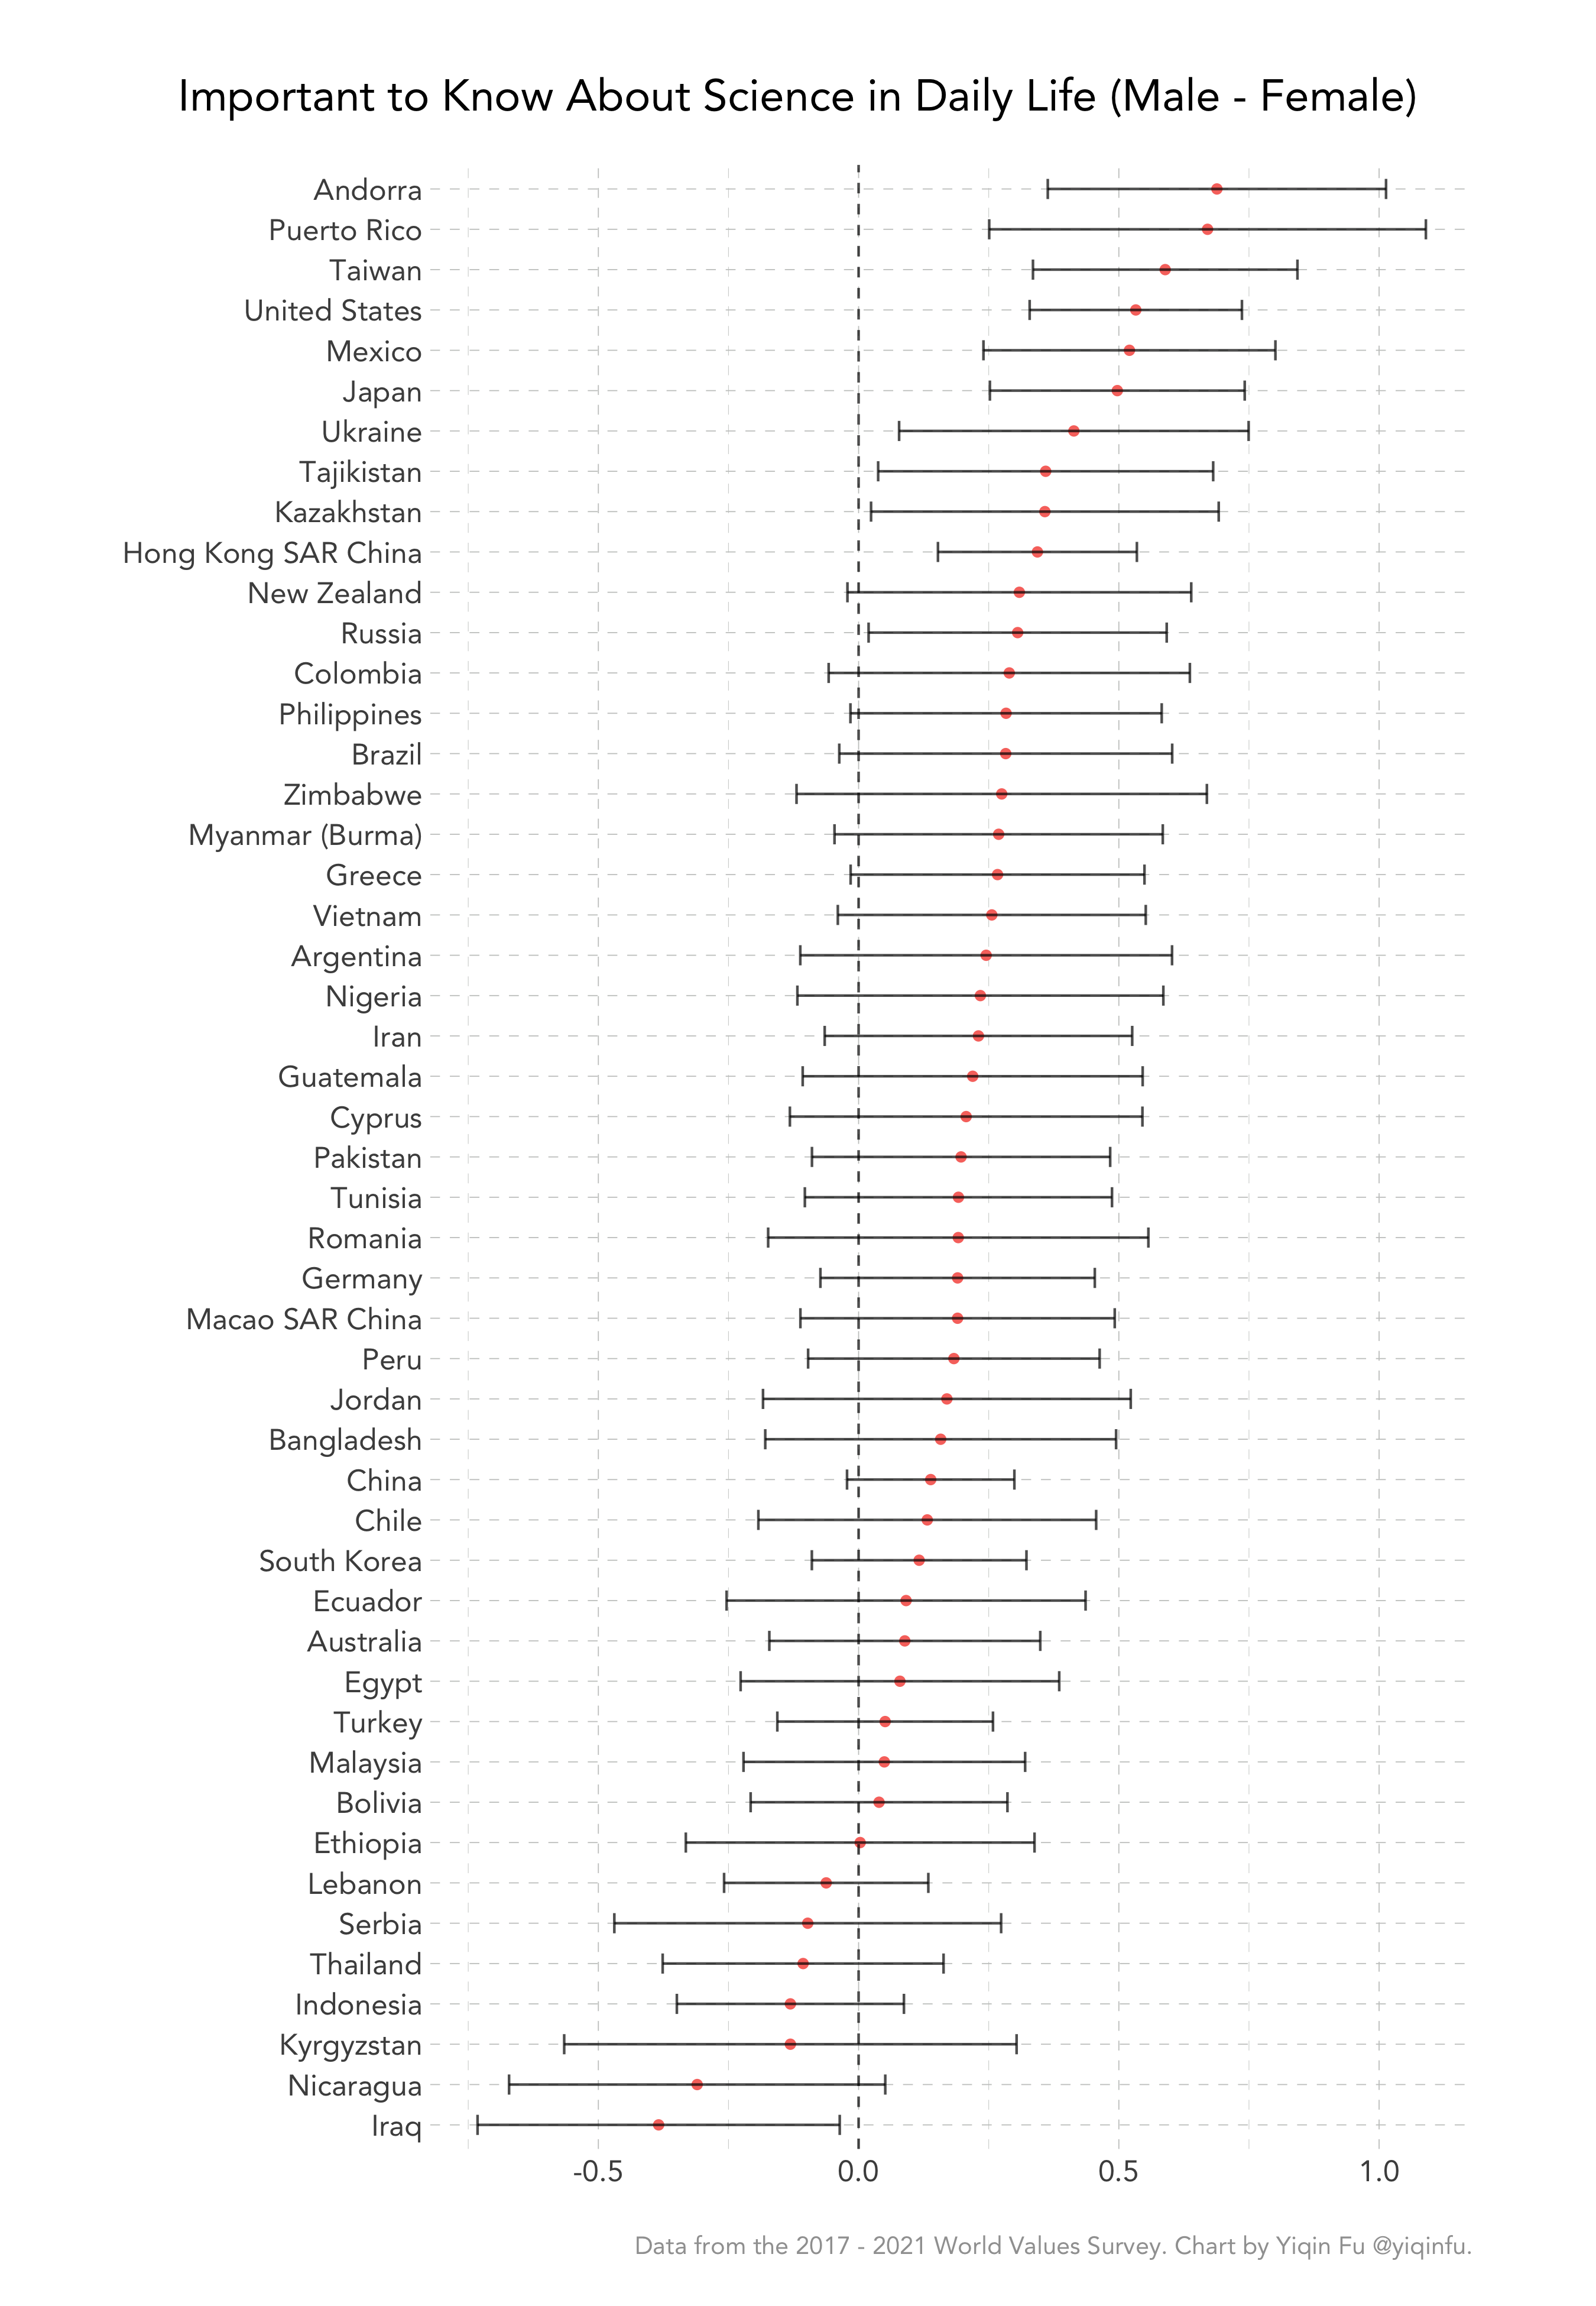
In terms of belief in the importance of personal scientific knowledge, we again see large gender differences in some countries and regions, including Andorra, Puerto Rico, Taiwan, the U.S., Japan, and Hong Kong.
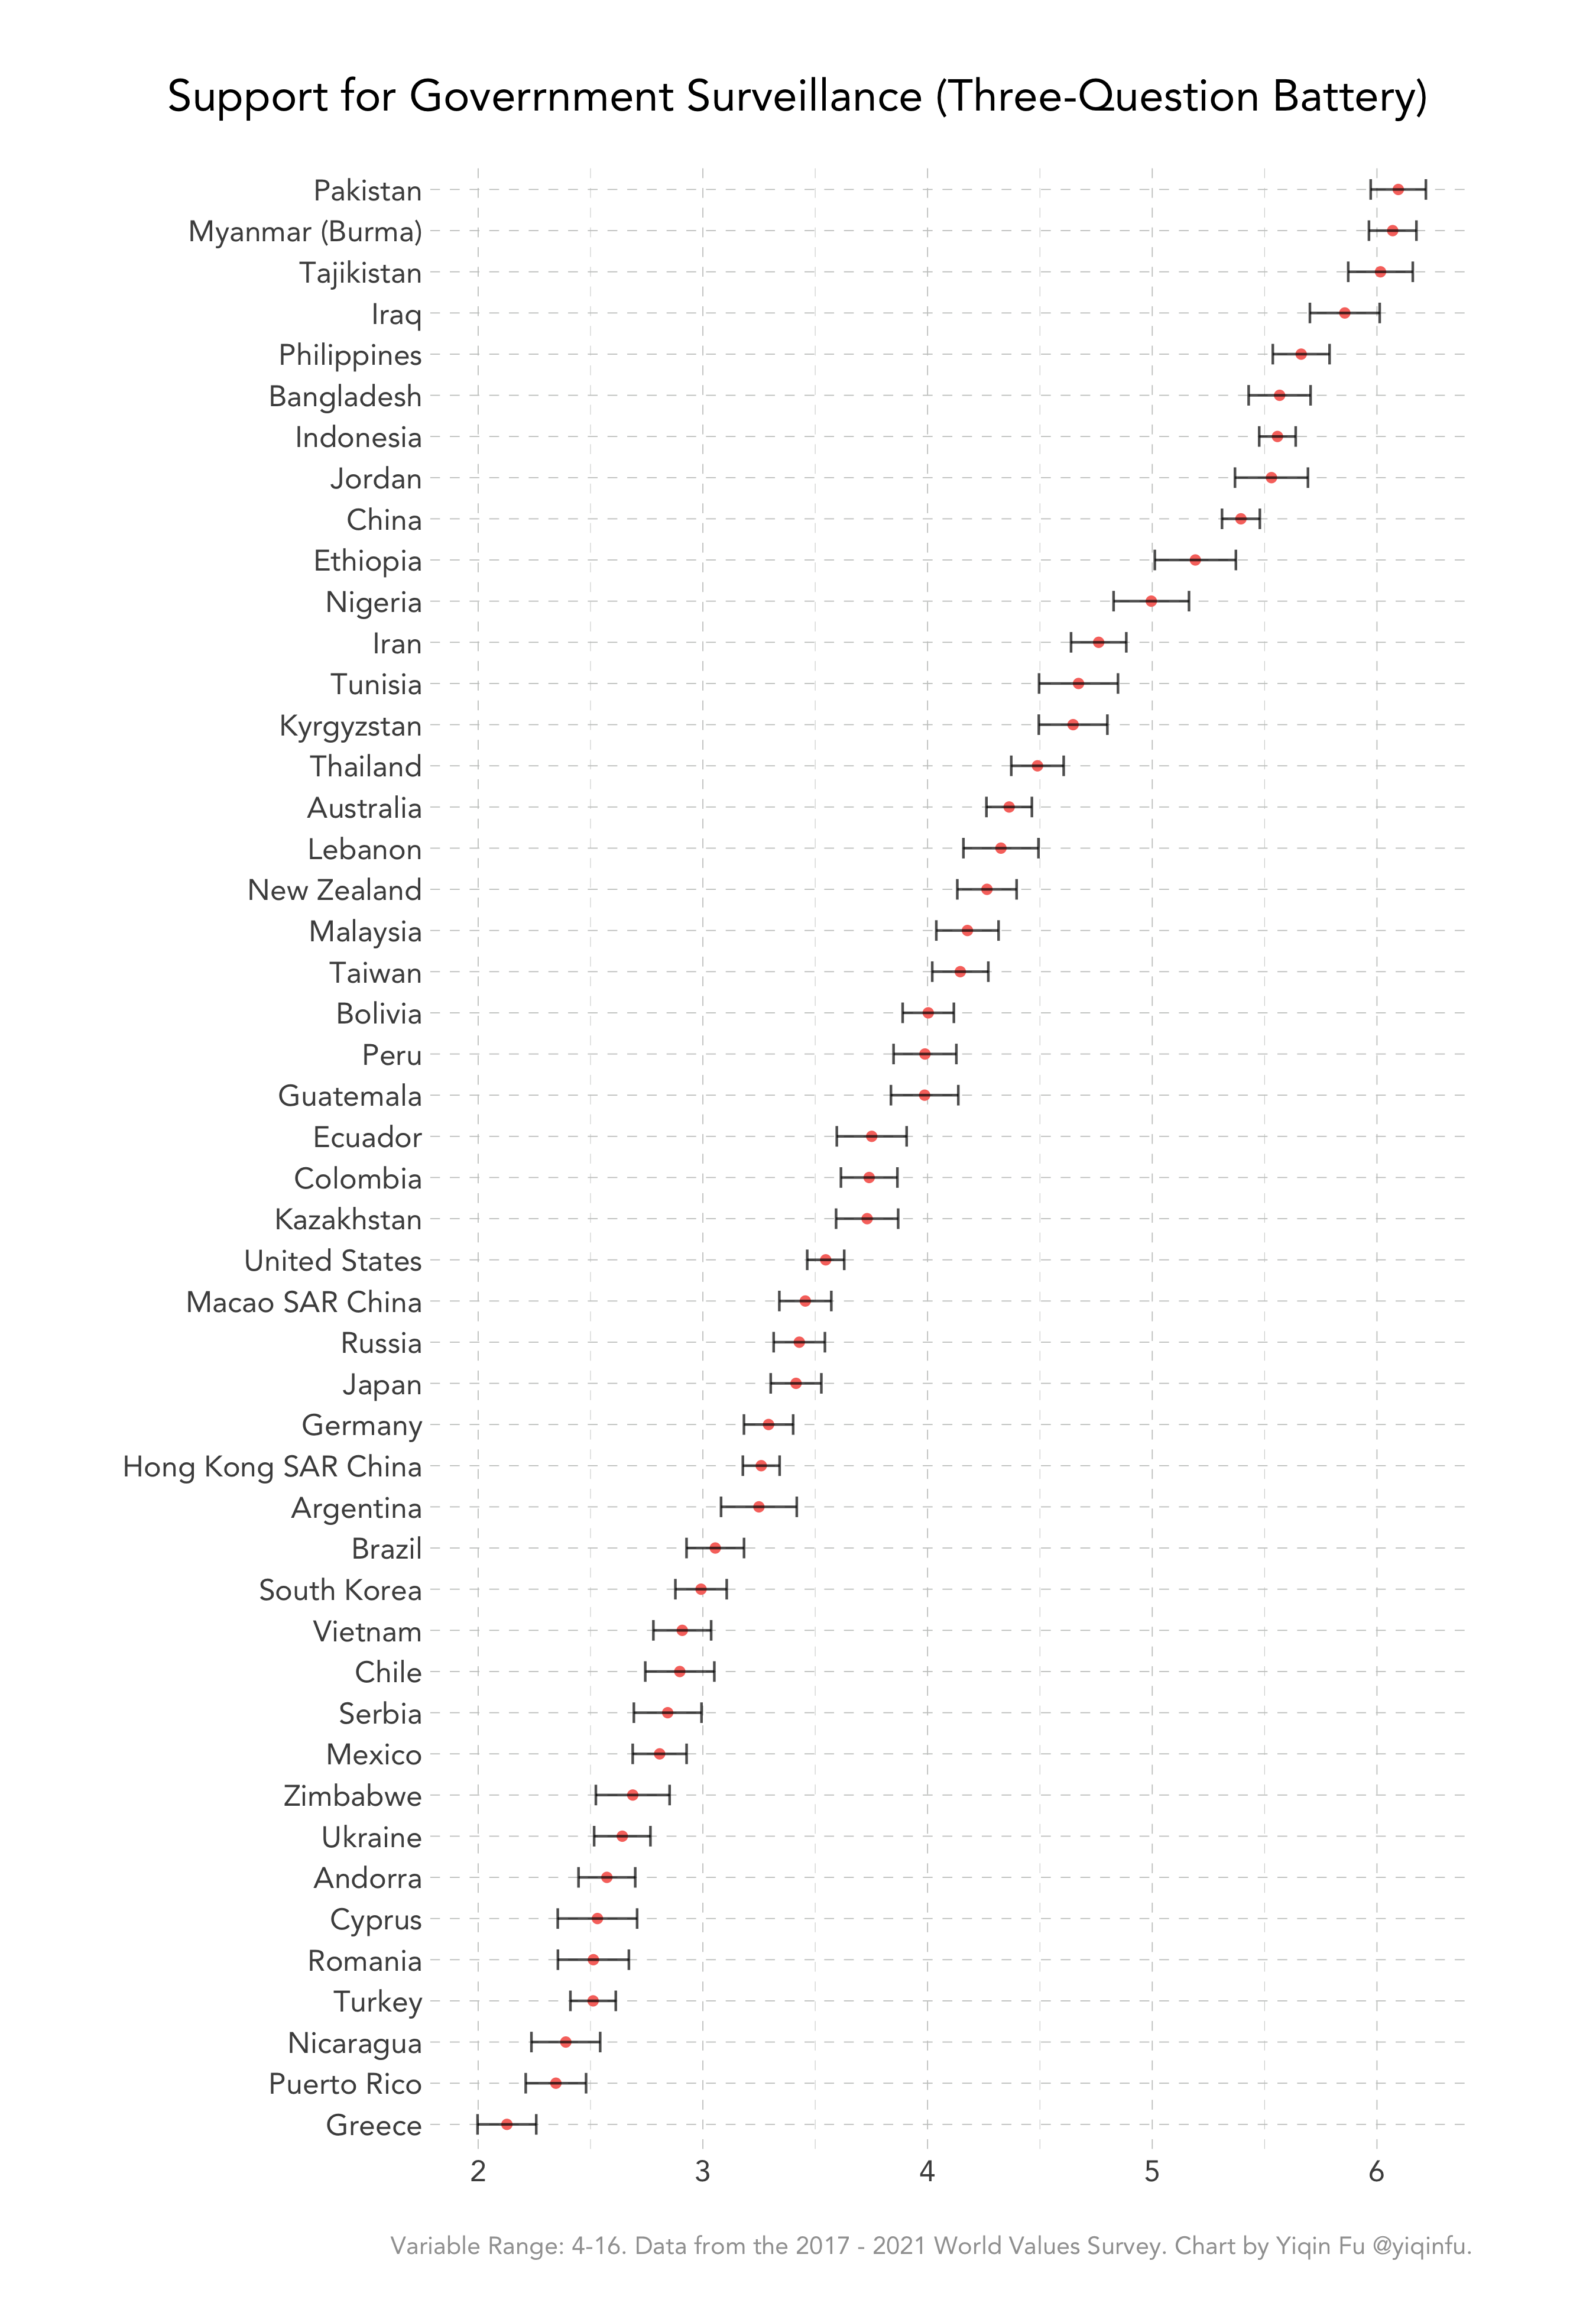
Attitudes Towards Surveillance
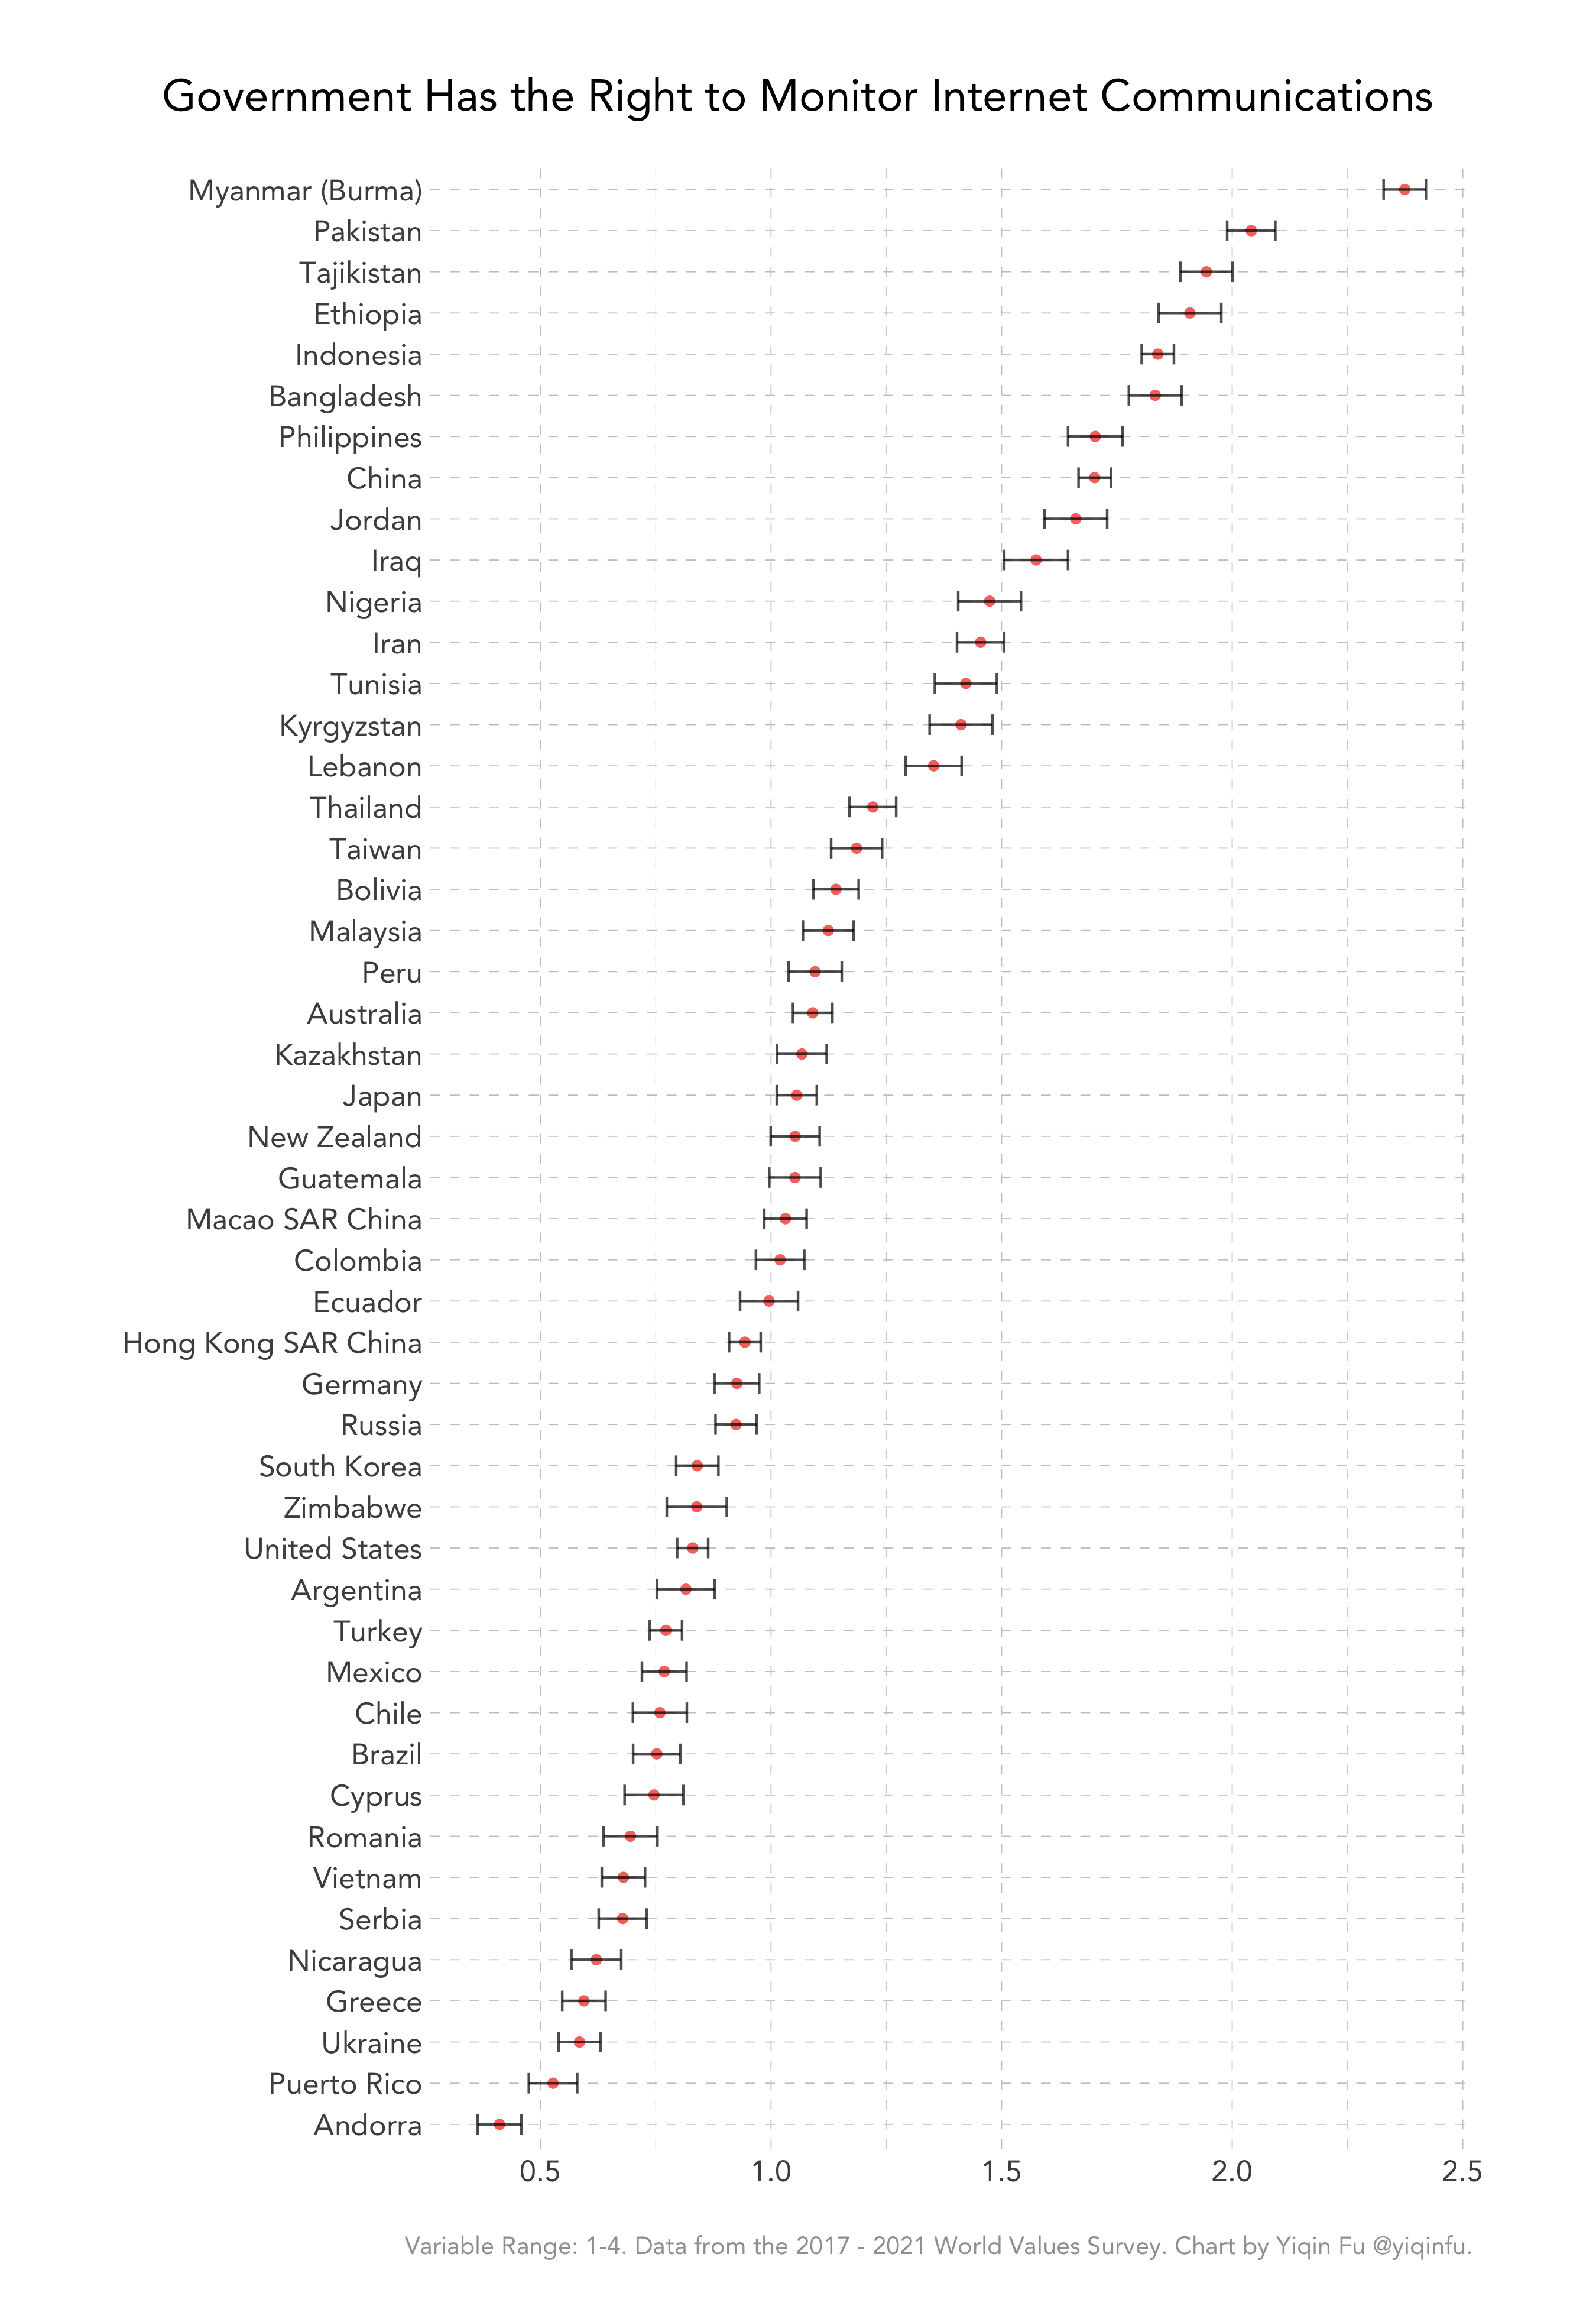
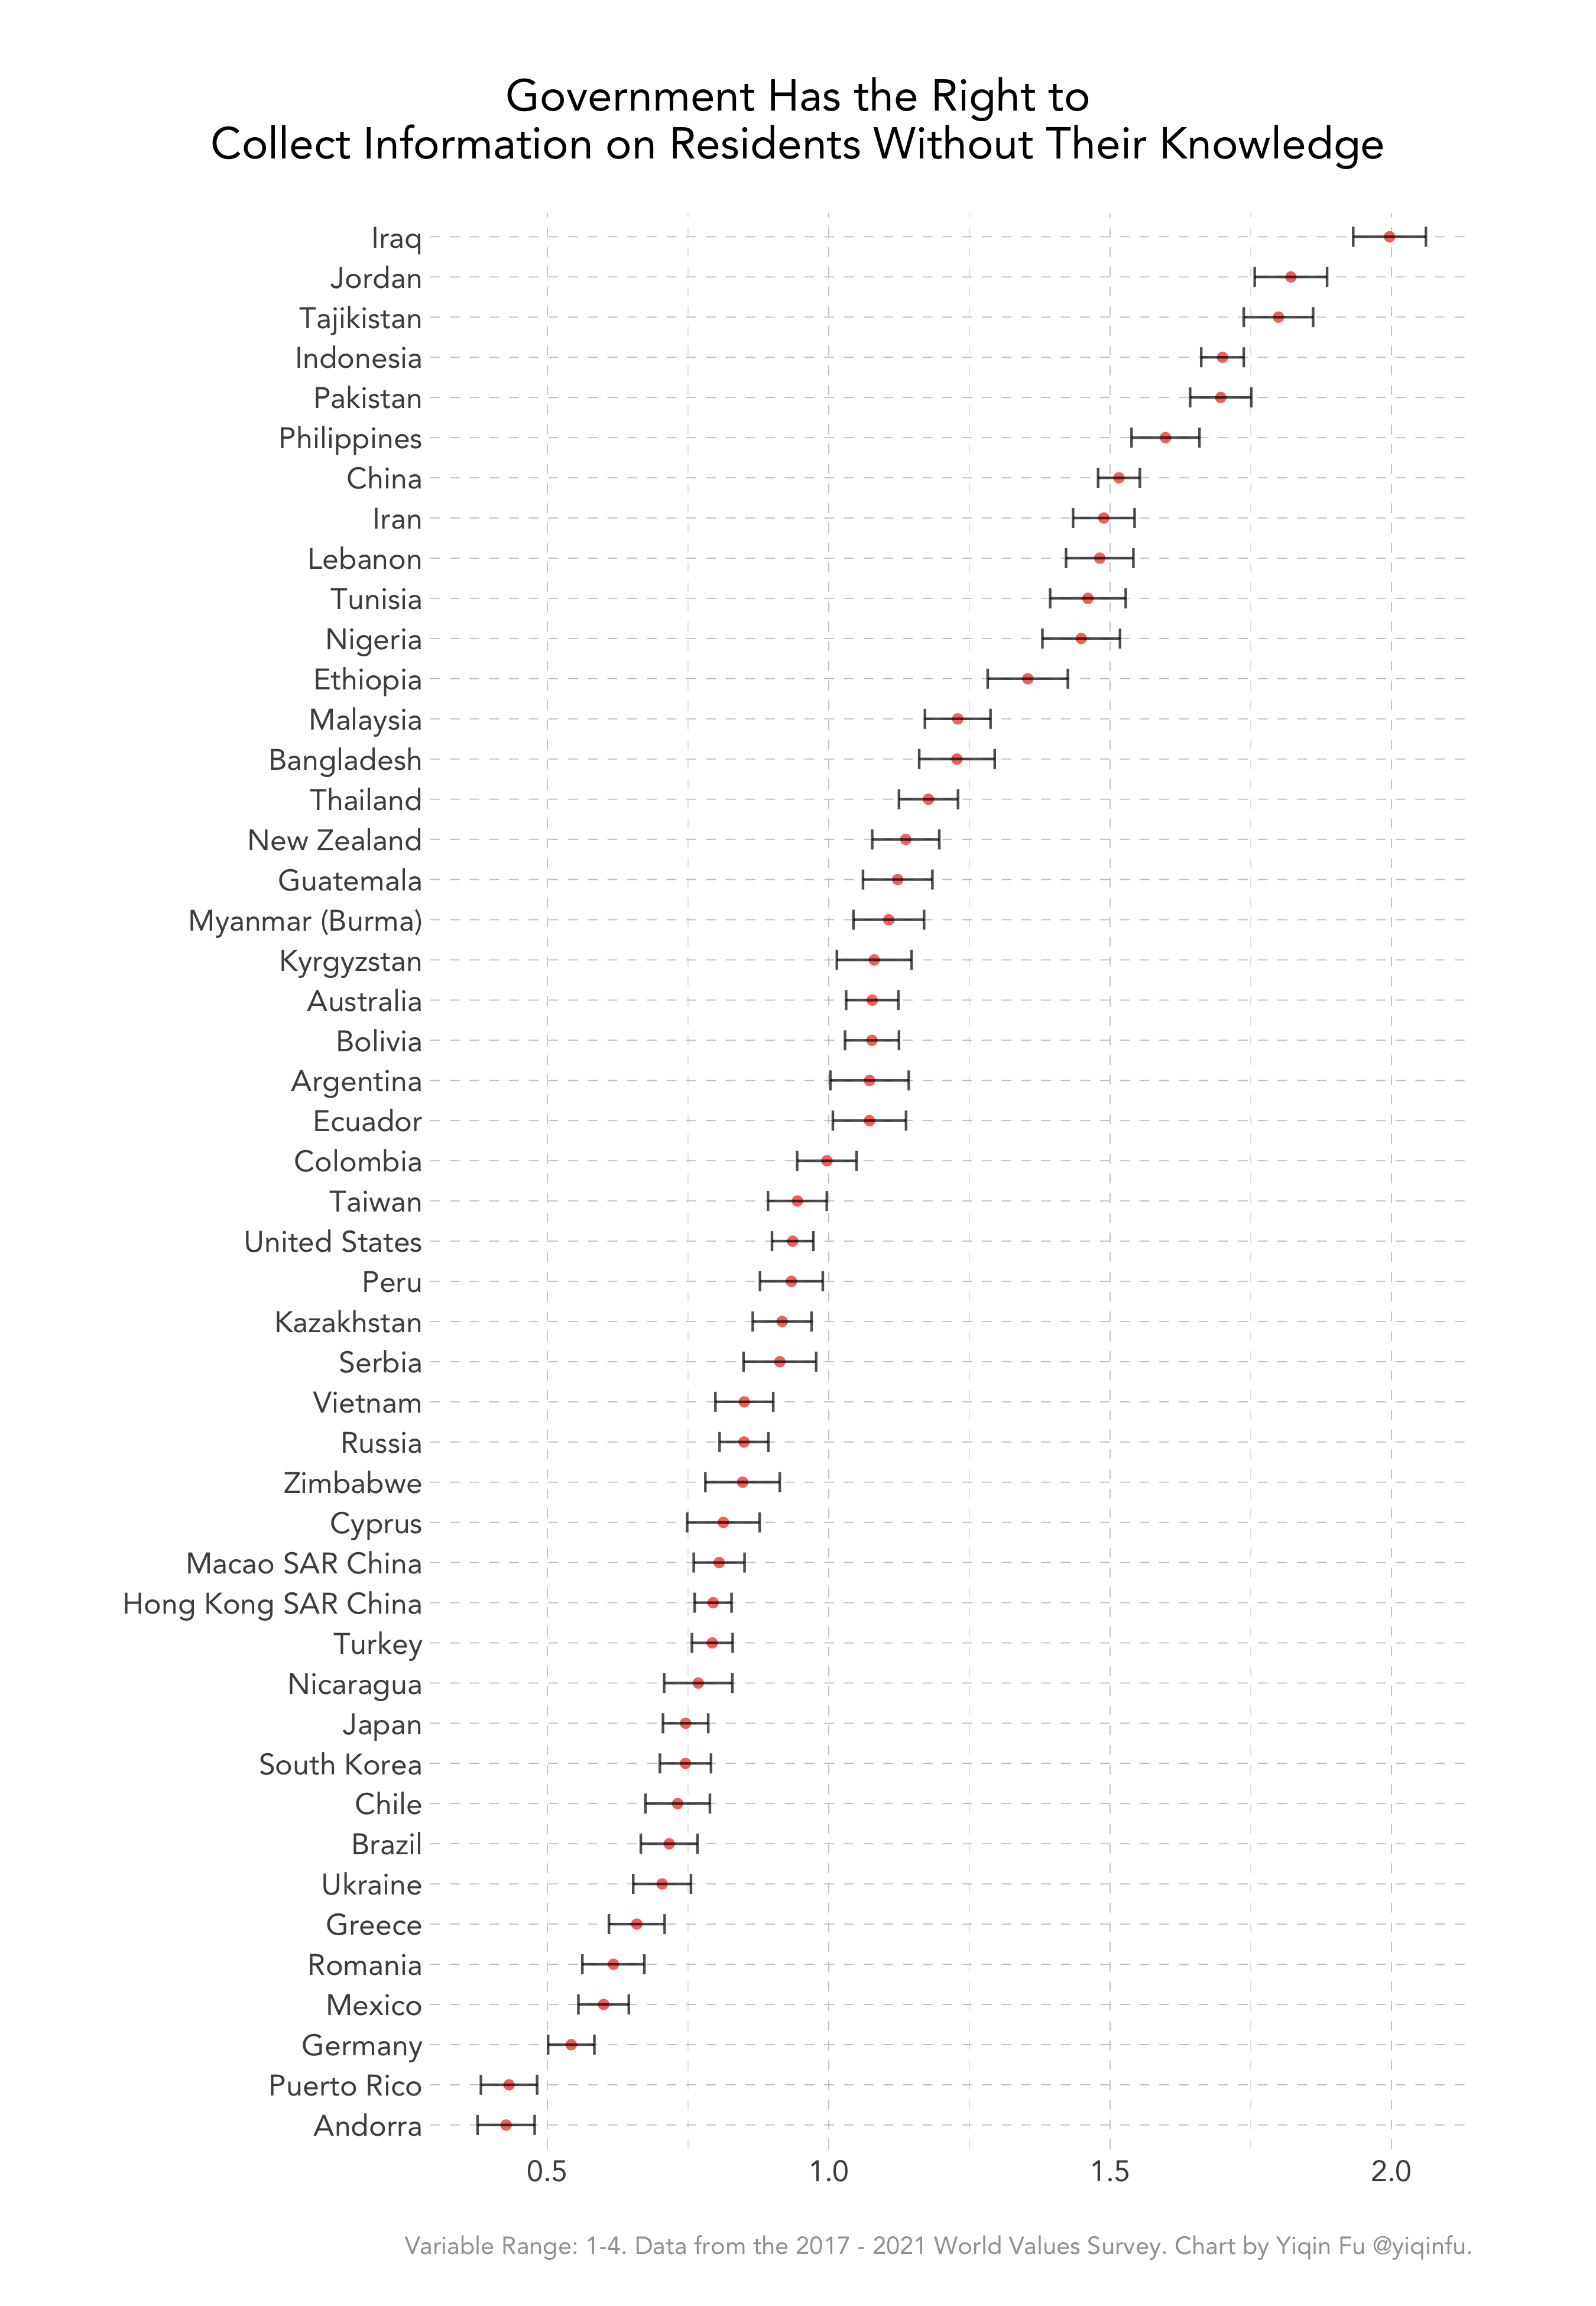
In addition to science and technology, the World Values Survey also asked whether people thought their country’s government should or should not have the right to do the following: (1-4 scale)
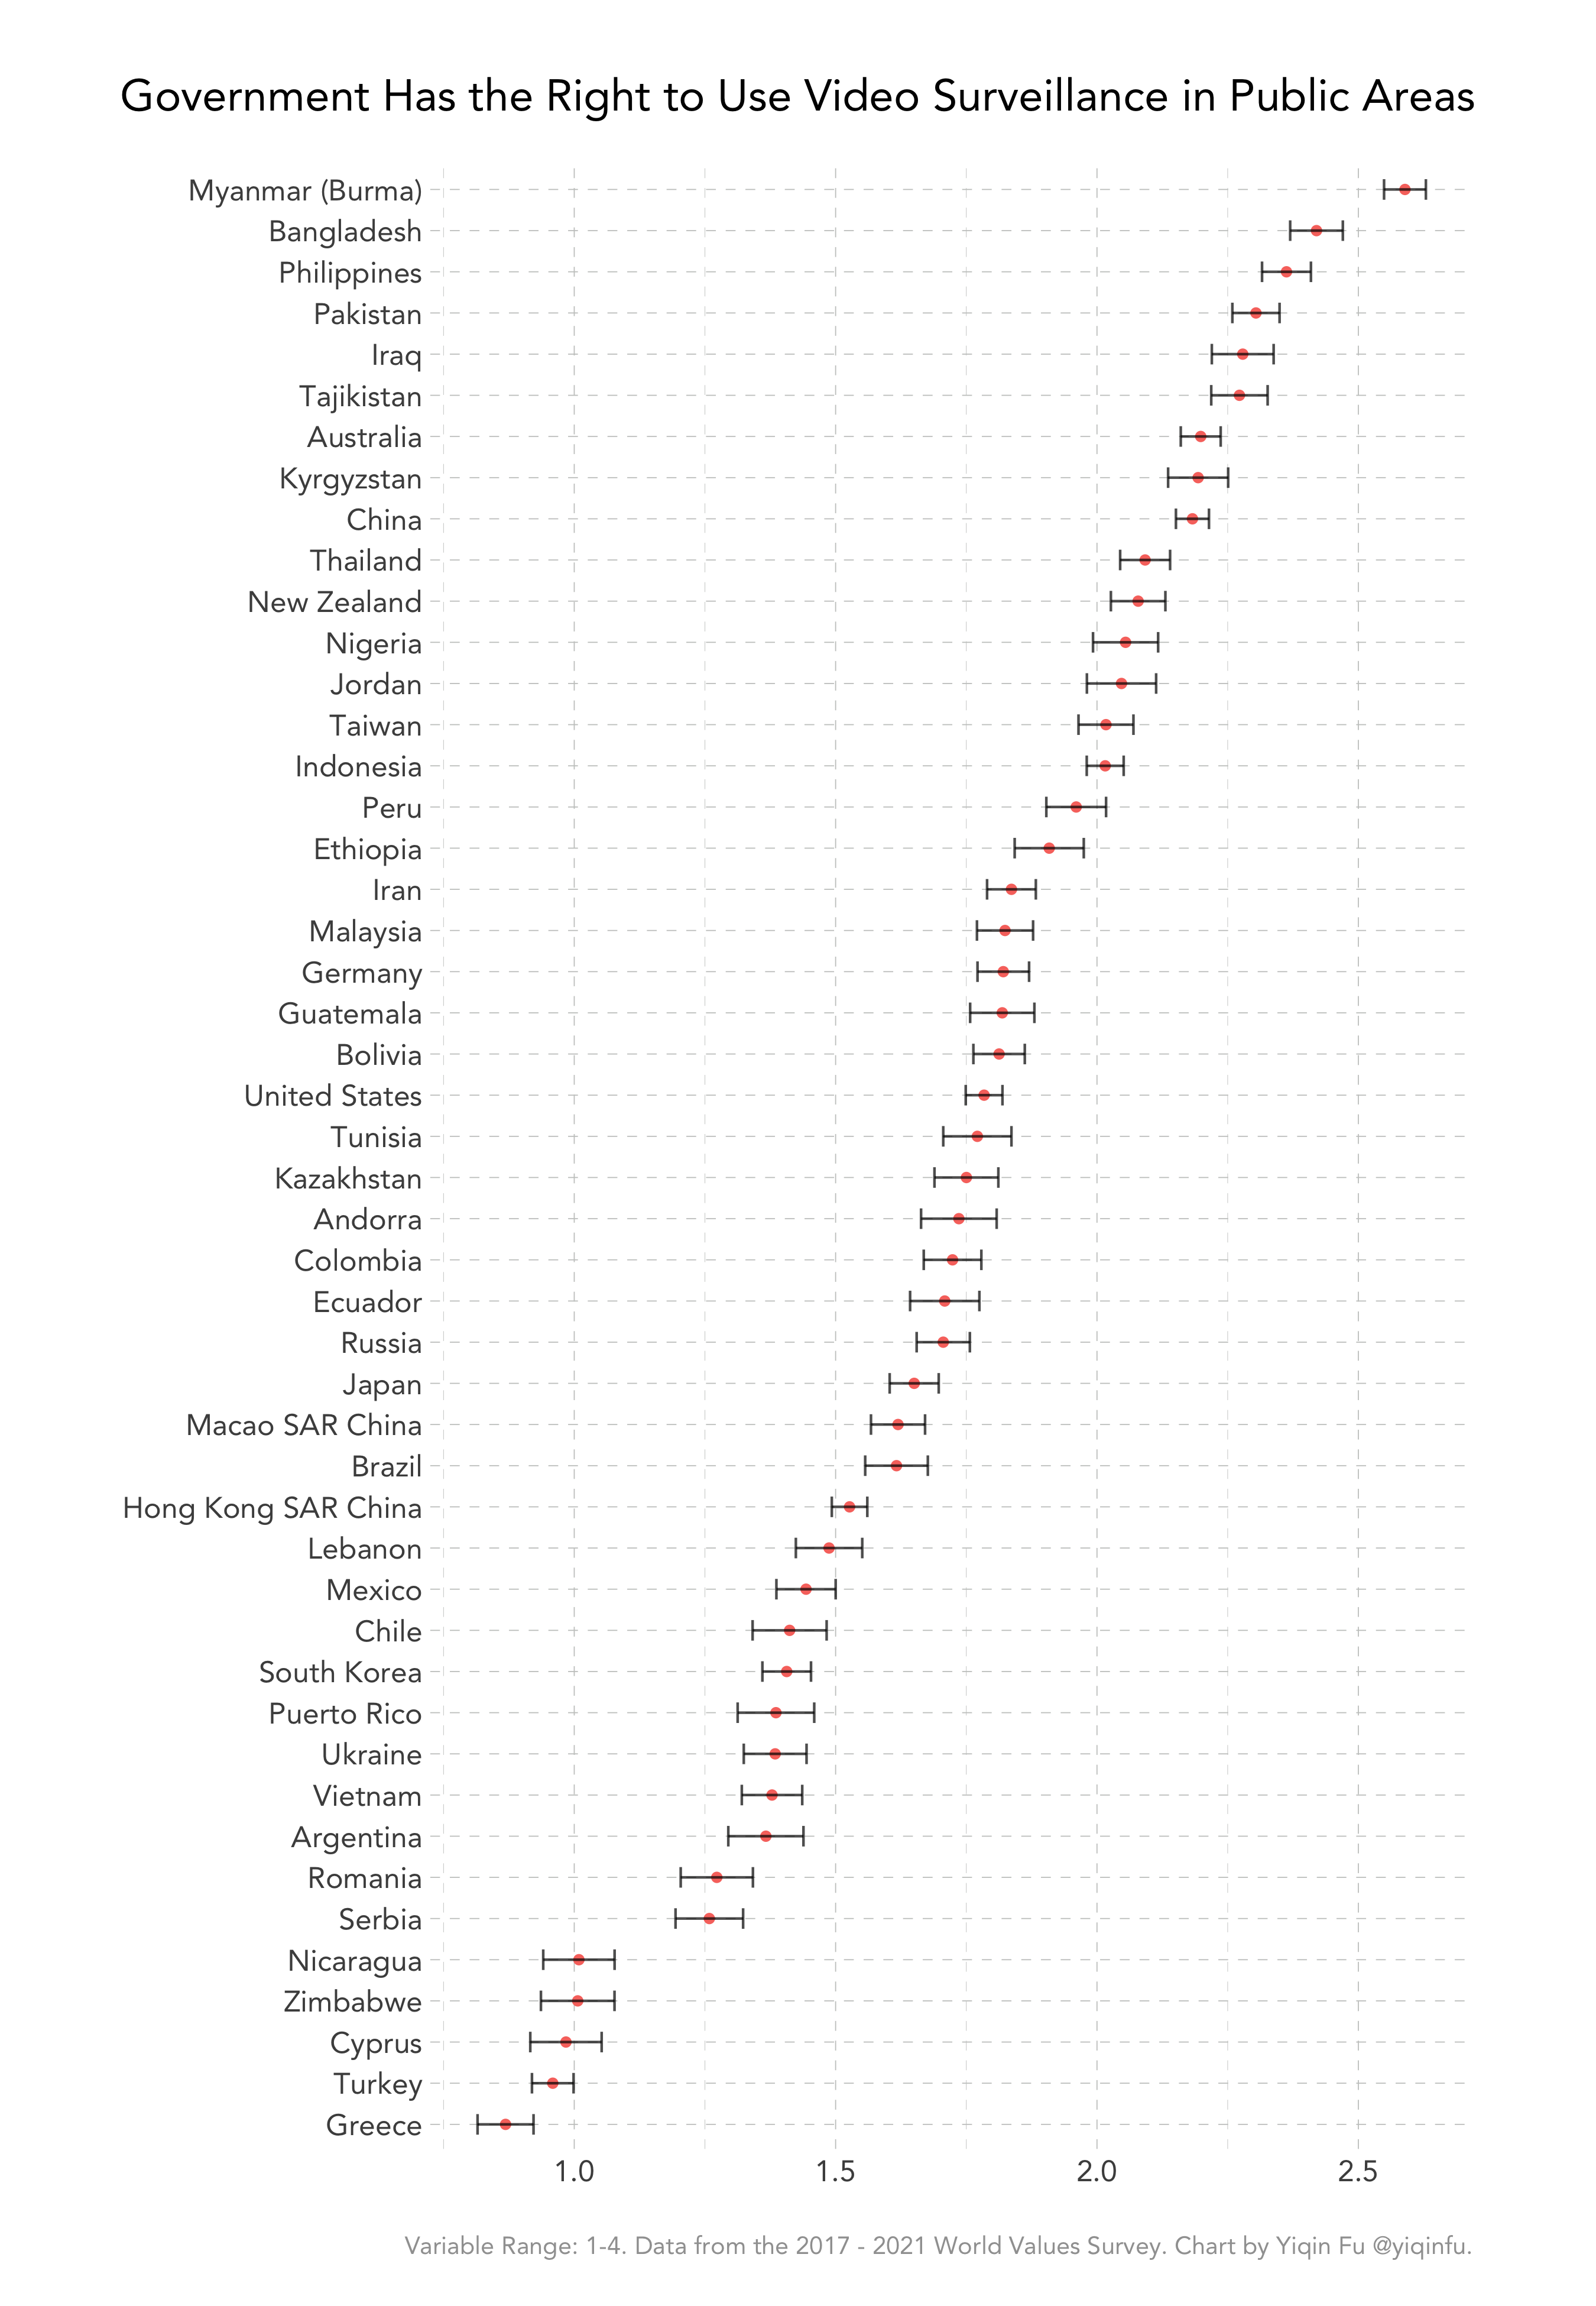
- Keep people under video surveillance in public areas
- Monitor all e-mails and any other information exchanged on the Internet
- Collect information about anyone living in this country without their knowledge
Here are the country averages for the “support for surveillance” index as well as its individual parts:
Growth, Democracy, and Support for Government Surveillance
Is it the case that support for surveillance is higher in high-growth, repressive societies? Surprisingly, the aggregate-level relationship between growth and support for surveillance is a stronger than that between democracy and support for surveillance.
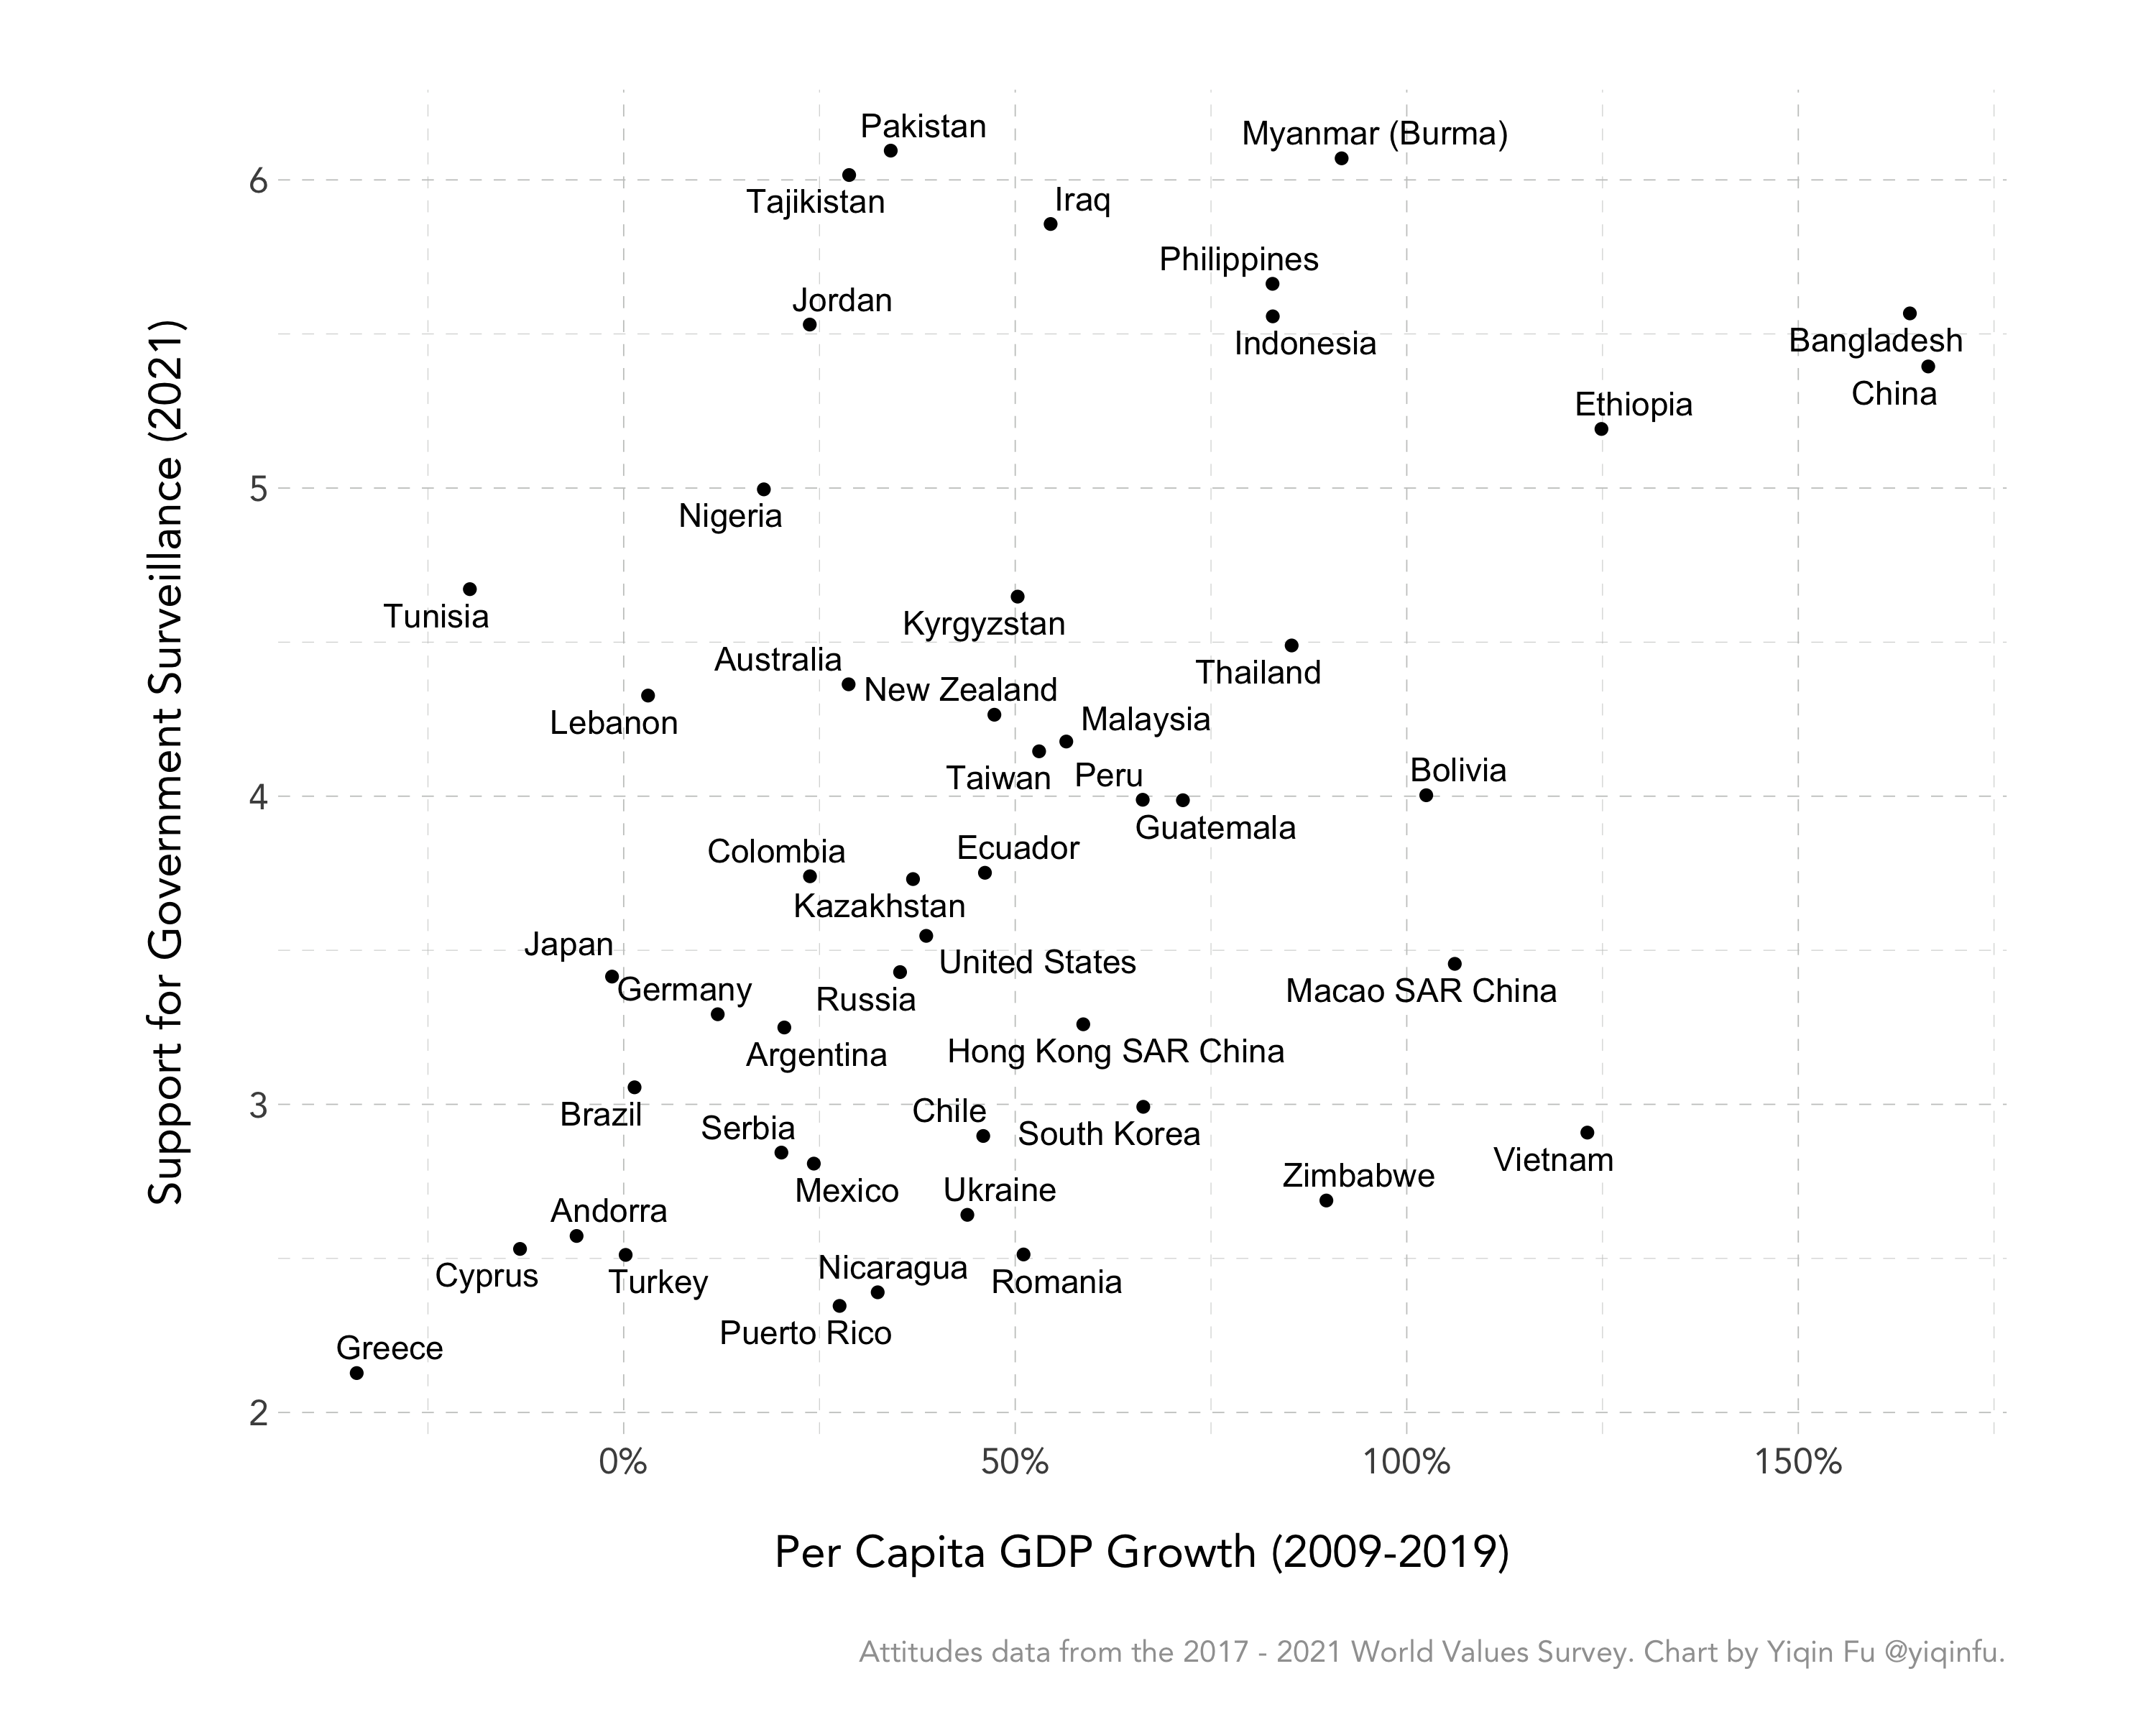
The figure above shows that there is, at the aggregate level, a positive relationship between GDP growth and support for government surveillance (R-squared 0.15).
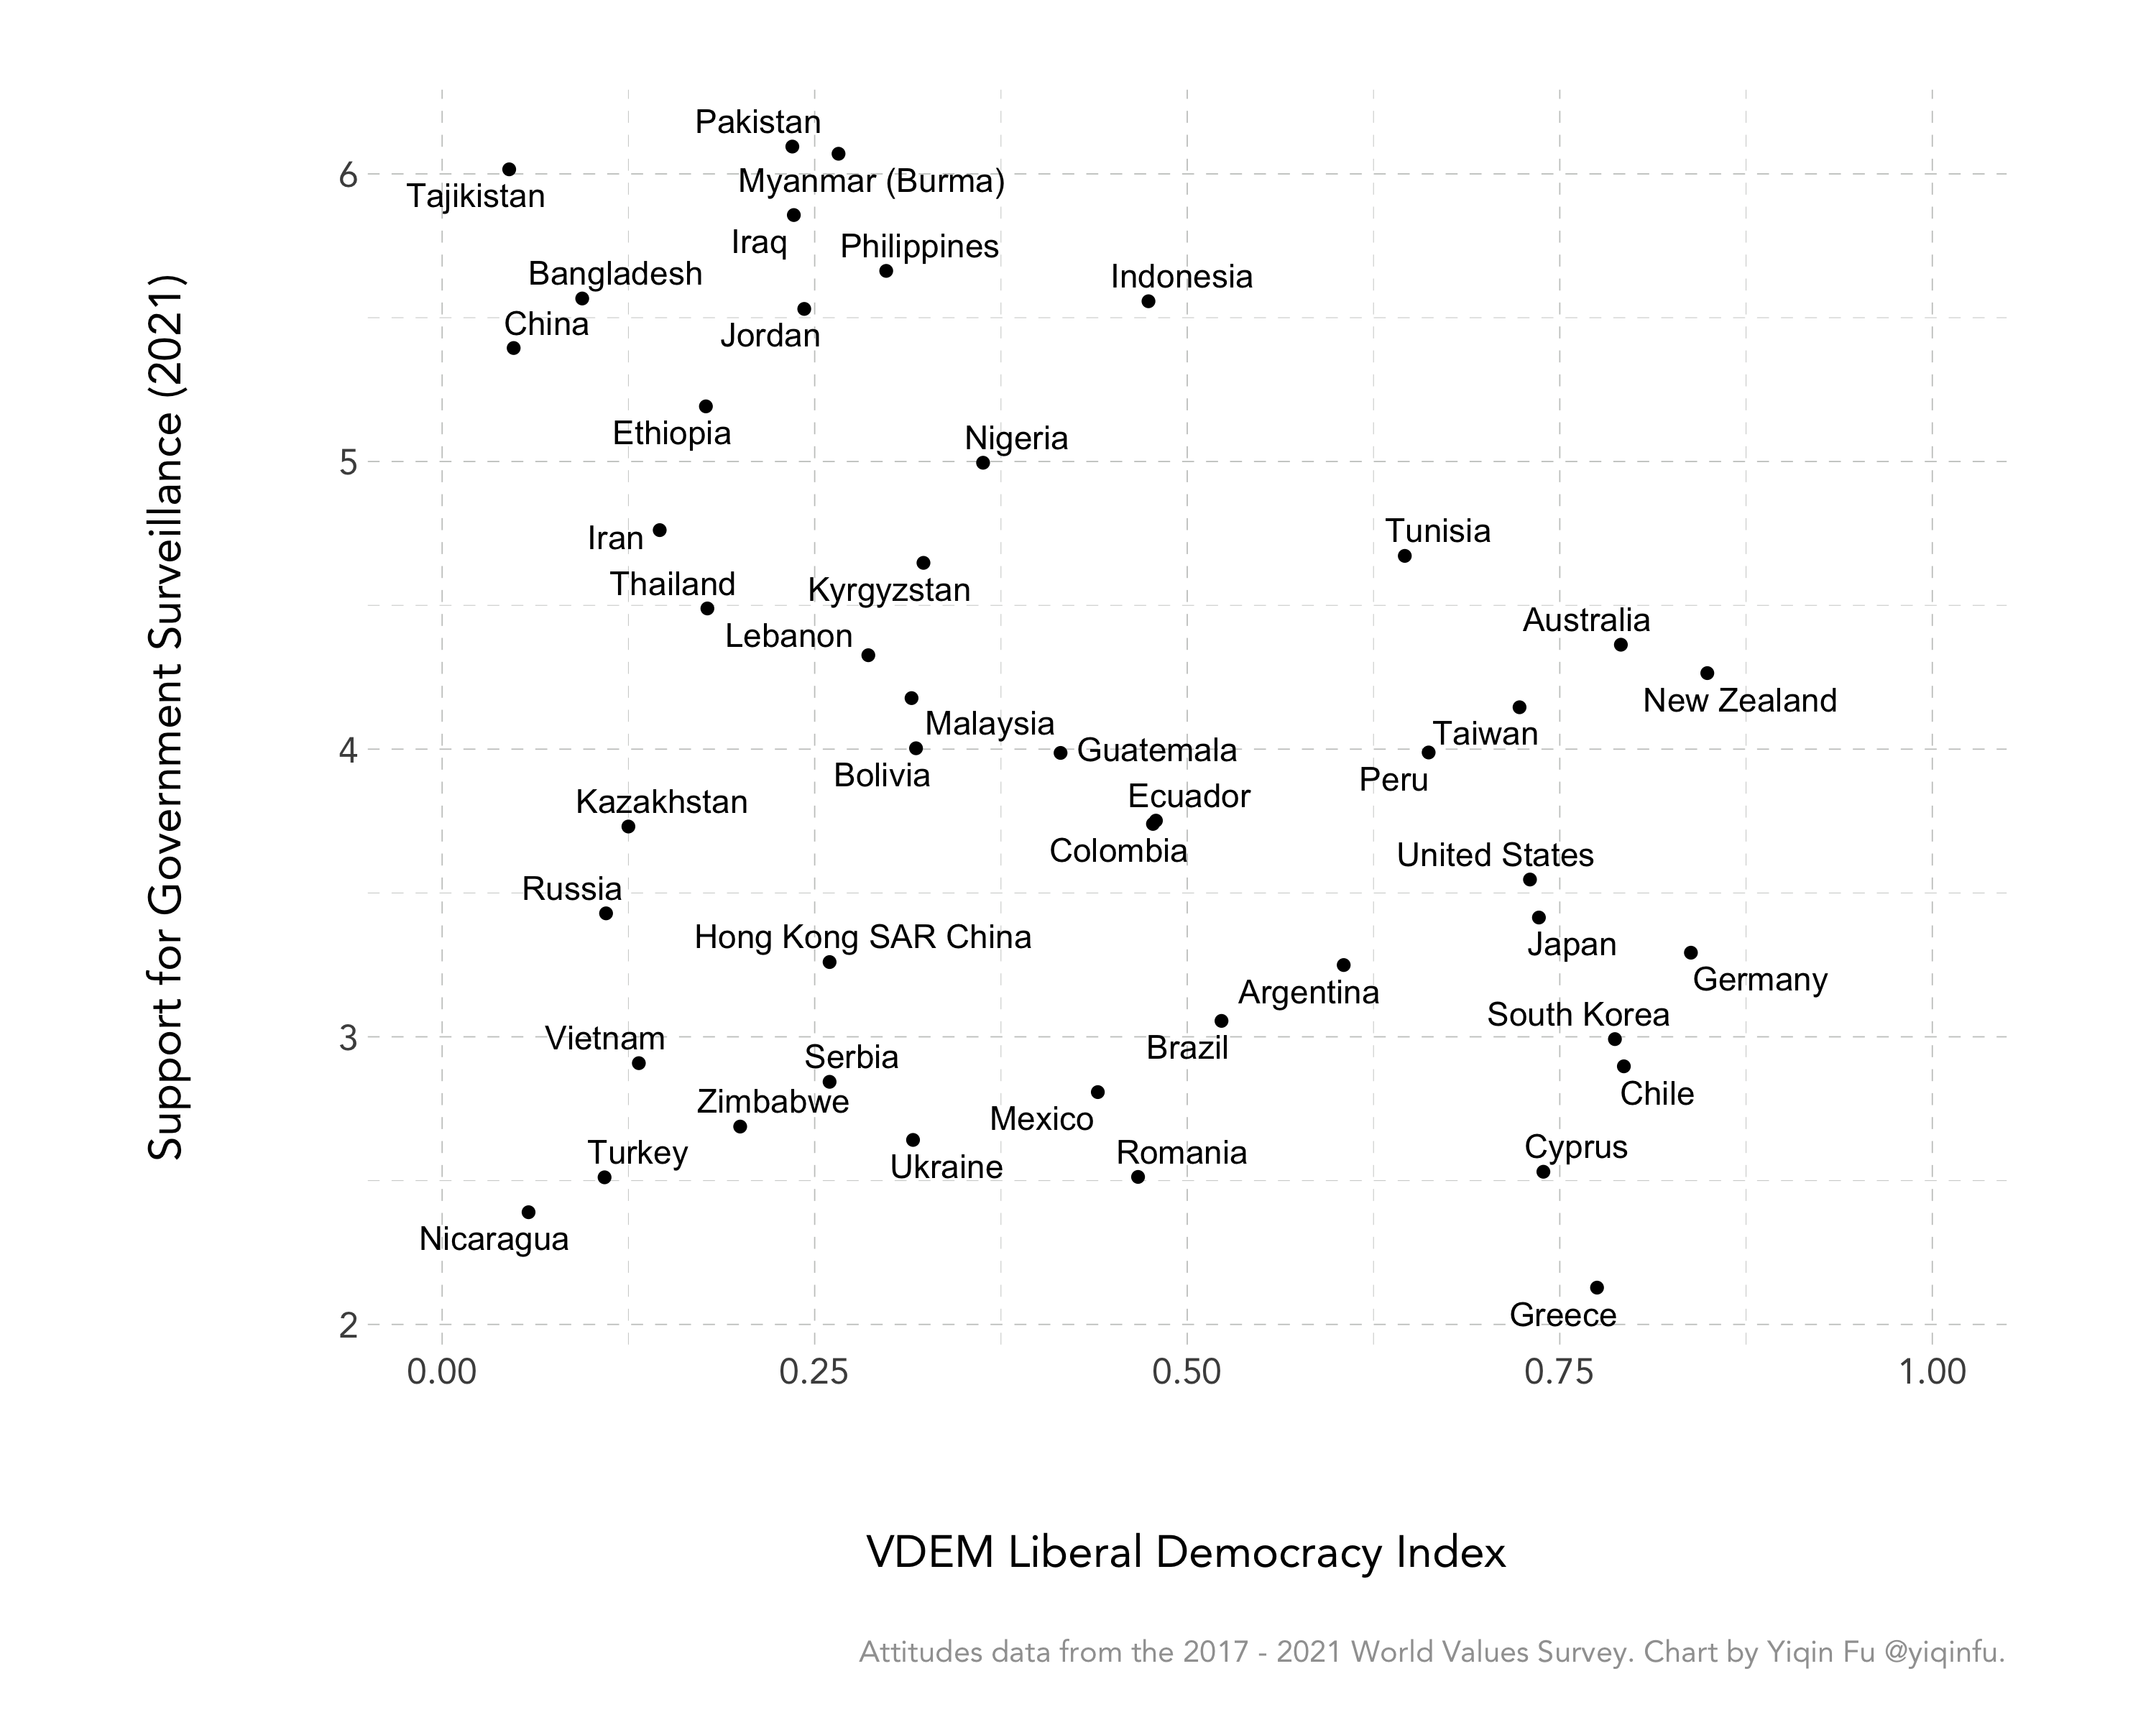
As shown above, the (negative) relationship between democracy and support for surveillance is weaker in absolute terms (R-squared 0.10).
Note: If self-censorship was present in survey response, many more in repressive societies ought to have expressed support for government surveillance, and the relationship between democracy and support for surveillance would’ve been much stronger.