Which Supreme Court Justices Vote Together the Most Often?
Jul 10, 2018 · 902 words · 5-minute read
Justice Anthony M. Kennedy’s retirement announcement on July 4 and President Trump’s subsequent nomination of Brett M. Kavanaugh as Kennedy’s replacement put the Supreme Court back in the spotlight.
Here is how The New York Times' Supreme Court correspondent Adam Liptak characterized the just-concluded 2017-2018 term (“OT2017” hereafter):
I don’t want to completely overstate the point that [the decisions were] all 5-4, [with] the conservatives on one side and the liberals on the other. There are exceptions. But this has been a term where the main theme has been ideological division.
Quantifying the justices' ideological division requires more sophisticated modeling. We can, however, tally the number of 5-4 cases as a crude approximation and compare with historical data. Lots of media outlets have performed this exercise before, typically grouping the number of cases by year or by chief justice. I enjoy those charts but find the two grouping methods unhelpful, because plotting by year would require me to know the difference between “Supreme Court (1989)” and “Supreme Court (2000)” by heart, and plotting by chief justice would group many different court compositions in one (e.g. every term after 2005 would be grouped under “the Roberts Court,” but we know instinctively that the court has changed a lot over the course of the years).
Thus, I thought grouping by unique court composition1 makes more sense – the period after Gorsuch joined the court would be considered a group; the period after Scalia’s death but before Gorsuch’s confirmation would be another, etc.
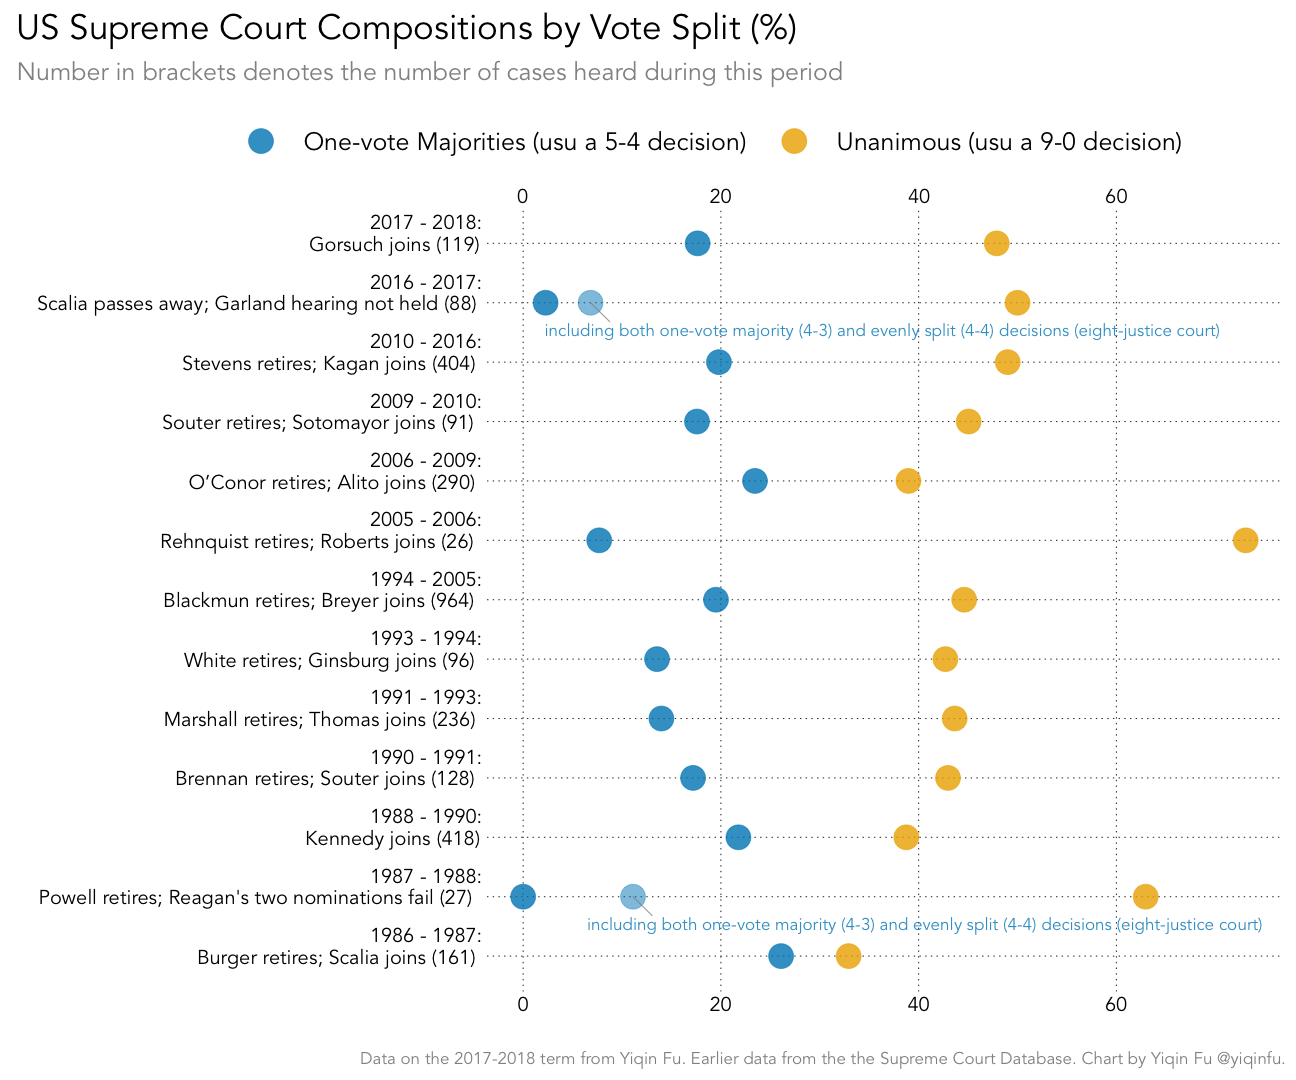
U.S. Supreme Court Vote Split by Court Compositions (Share of 5-4 and 9-0 Decisions)
The resulting chart (shown below) is a bit busy, but I hope it is easy to follow. Each row represents a different court composition, from the most recent to the least. We are just coming out of the top row (“2017-2018: Gorsuch joins”), and the number in brackets (“119”) denotes the number of cases the Court heard during this period.2

As shown above, roughly 20% of cases heard since Gorsuch joined were decided by one-vote majorities (i.e. 5-4 decisions), not much different from other periods in the Court’s recent history. Similarly, roughly 45% of cases were decided unanimously, not much different from other recent periods, either. Perhaps The New York Times' Liptak was comparing OT2017 with the period after Scalia’s death, when there were only eight justices on the bench. If we compare these two periods, it is the case that the just-concluded OT2017 has a larger share of 5-4 decisions.
Of course, the share of cases decided 5-4 is a very crude measure of the Court’s ideological division. The importance of cases is not taken into account (surely this past term’s Carpenter v. United States and Trump v. Hawaii are more important than some others). Furthermore, Supreme Court justices get to choose which cases to hear, so their vote split reflects only their division on a select group of issues.
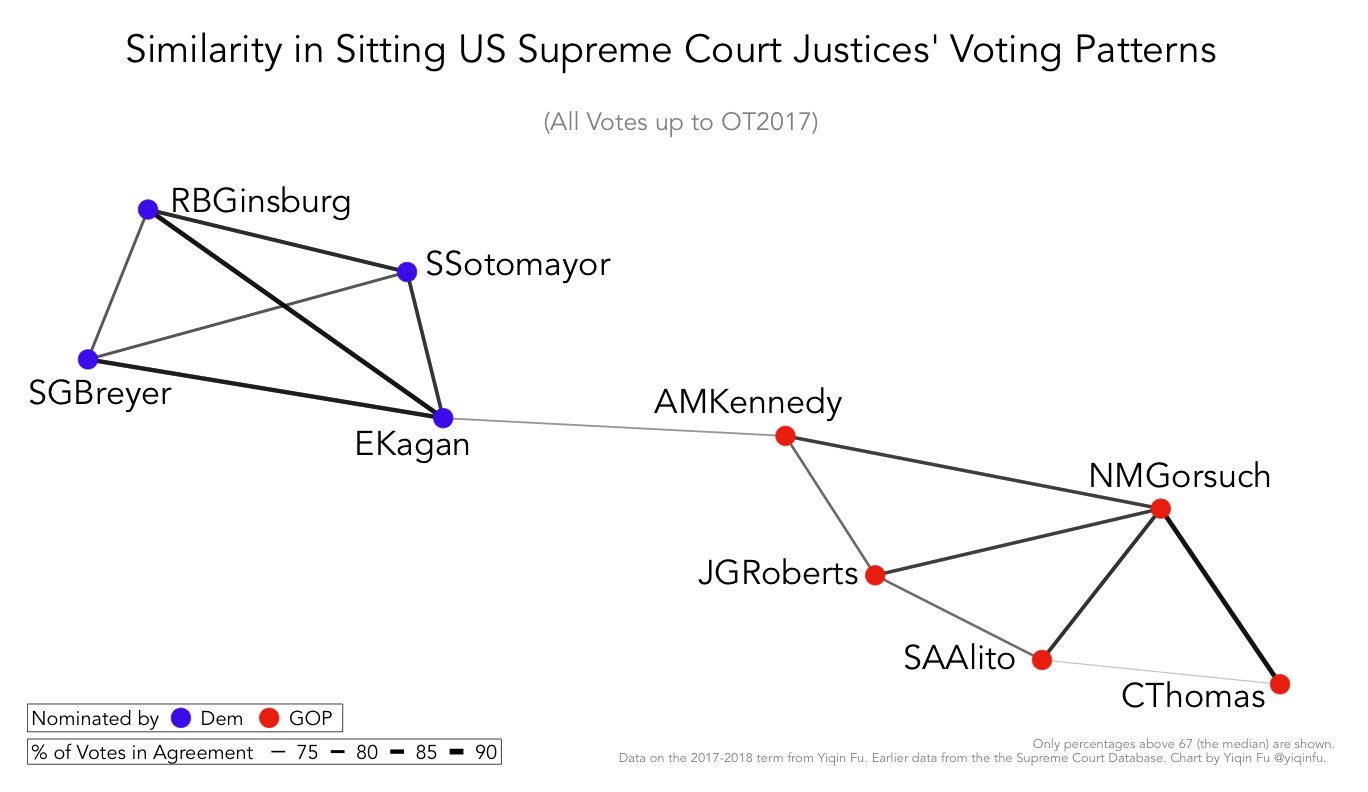
Network of Sitting U.S. Supreme Court Justices by Voting Coincidence
Next, we turn to voting patterns of individual justices and compare who votes with whom most and least often. Again, many articles have been written on this topic, typically using tables to show the percentage of decisions in agreement between justices.
I find it easier to understand the relationship between justices if we draw network diagrams that show the closest voting patterns. As seen below, two justices are connected by a line if they vote together more than 67% of the time, and the darker/thicker the line is, the closer they are in voting patterns. I choose 67% because it is the median – Justice Thomas and Justice Sotomayor have the lowest percentage (46%), whereas Justice Gorsuch and Justice Thomas have the highest (86%).

It is remarkable that Justice Kennedy is the only one connecting the blue blob on the left with the red blob on the right. Given that President Trump’s nominee Brett M. Kavanaugh is widely expected to be more conservative than Justice Kennedy, the network diagram I will draw next year probably has two entirely separate mini-networks, one blue and one red, with no lines drawn between them.
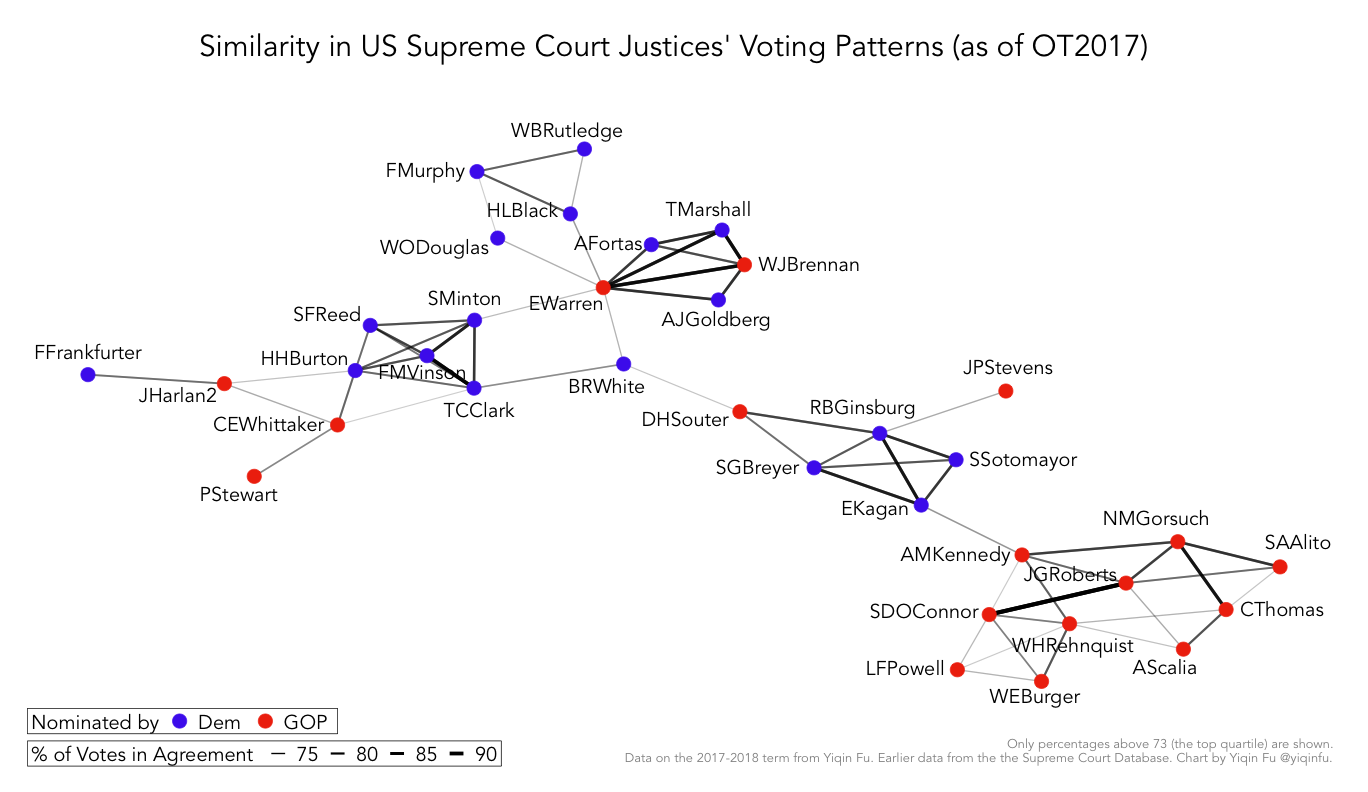
Network of All Historical U.S. Supreme Court Justices by Voting Coincidence
If we go back in time, we can see that the red and the blue dots did mingle in the past, most recently in the cases of Justice Souter (nominated by Republican President George H. W. Bush), Justice Stevens (nominated by Republican President Ford), Justice Brennan and Justice Warren (nominated by Republican President Eisenhower), and Justice Frankfurter (nominated by Democratic President FDR).

Will the red and the blue dots cease to have any lines drawn between them? Will the lines within the red or the blue blob get thicker and thicker over time? We will return to these diagrams in a few years.
Note: Many thanks to researchers at the Supreme Court Database for creating and maintaining the dataset, and for responding to inquiries in less than a day.
-
Legal scholars use the term “natural court” to denote a court with no personnel changes. “Roberts 5” is the court before Gorsuch was confirmed, and “Roberts 6” is the one after. We will soon enter “Roberts 7” when Trump’s nominee Brett M. Kavanaugh joins the bench. ↩︎
-
Note that the “2017-2018” in the first row of the chart does not refer to the 2017-2018 term. Instead, the period starts in April 2017 when Gorsuch joined the court. ↩︎