Who Votes with China, and Who Votes with the U.S. and Europe at the UN?
Jun 10, 2018 · 1286 words · 7-minute read
The United Nations General Assembly (UNGA) is the UN’s main deliberative and only universally representative body. What do UNGA voting patterns reveal about countries' ideological alignment?
In this post, I will visualize China’s voting records vis-à-vis those of the U.S. and Europe.
2020 Update: I have built an interactive site that lets you select custom year, country, and issue inputs.
Most Similar and Dissimilar to China
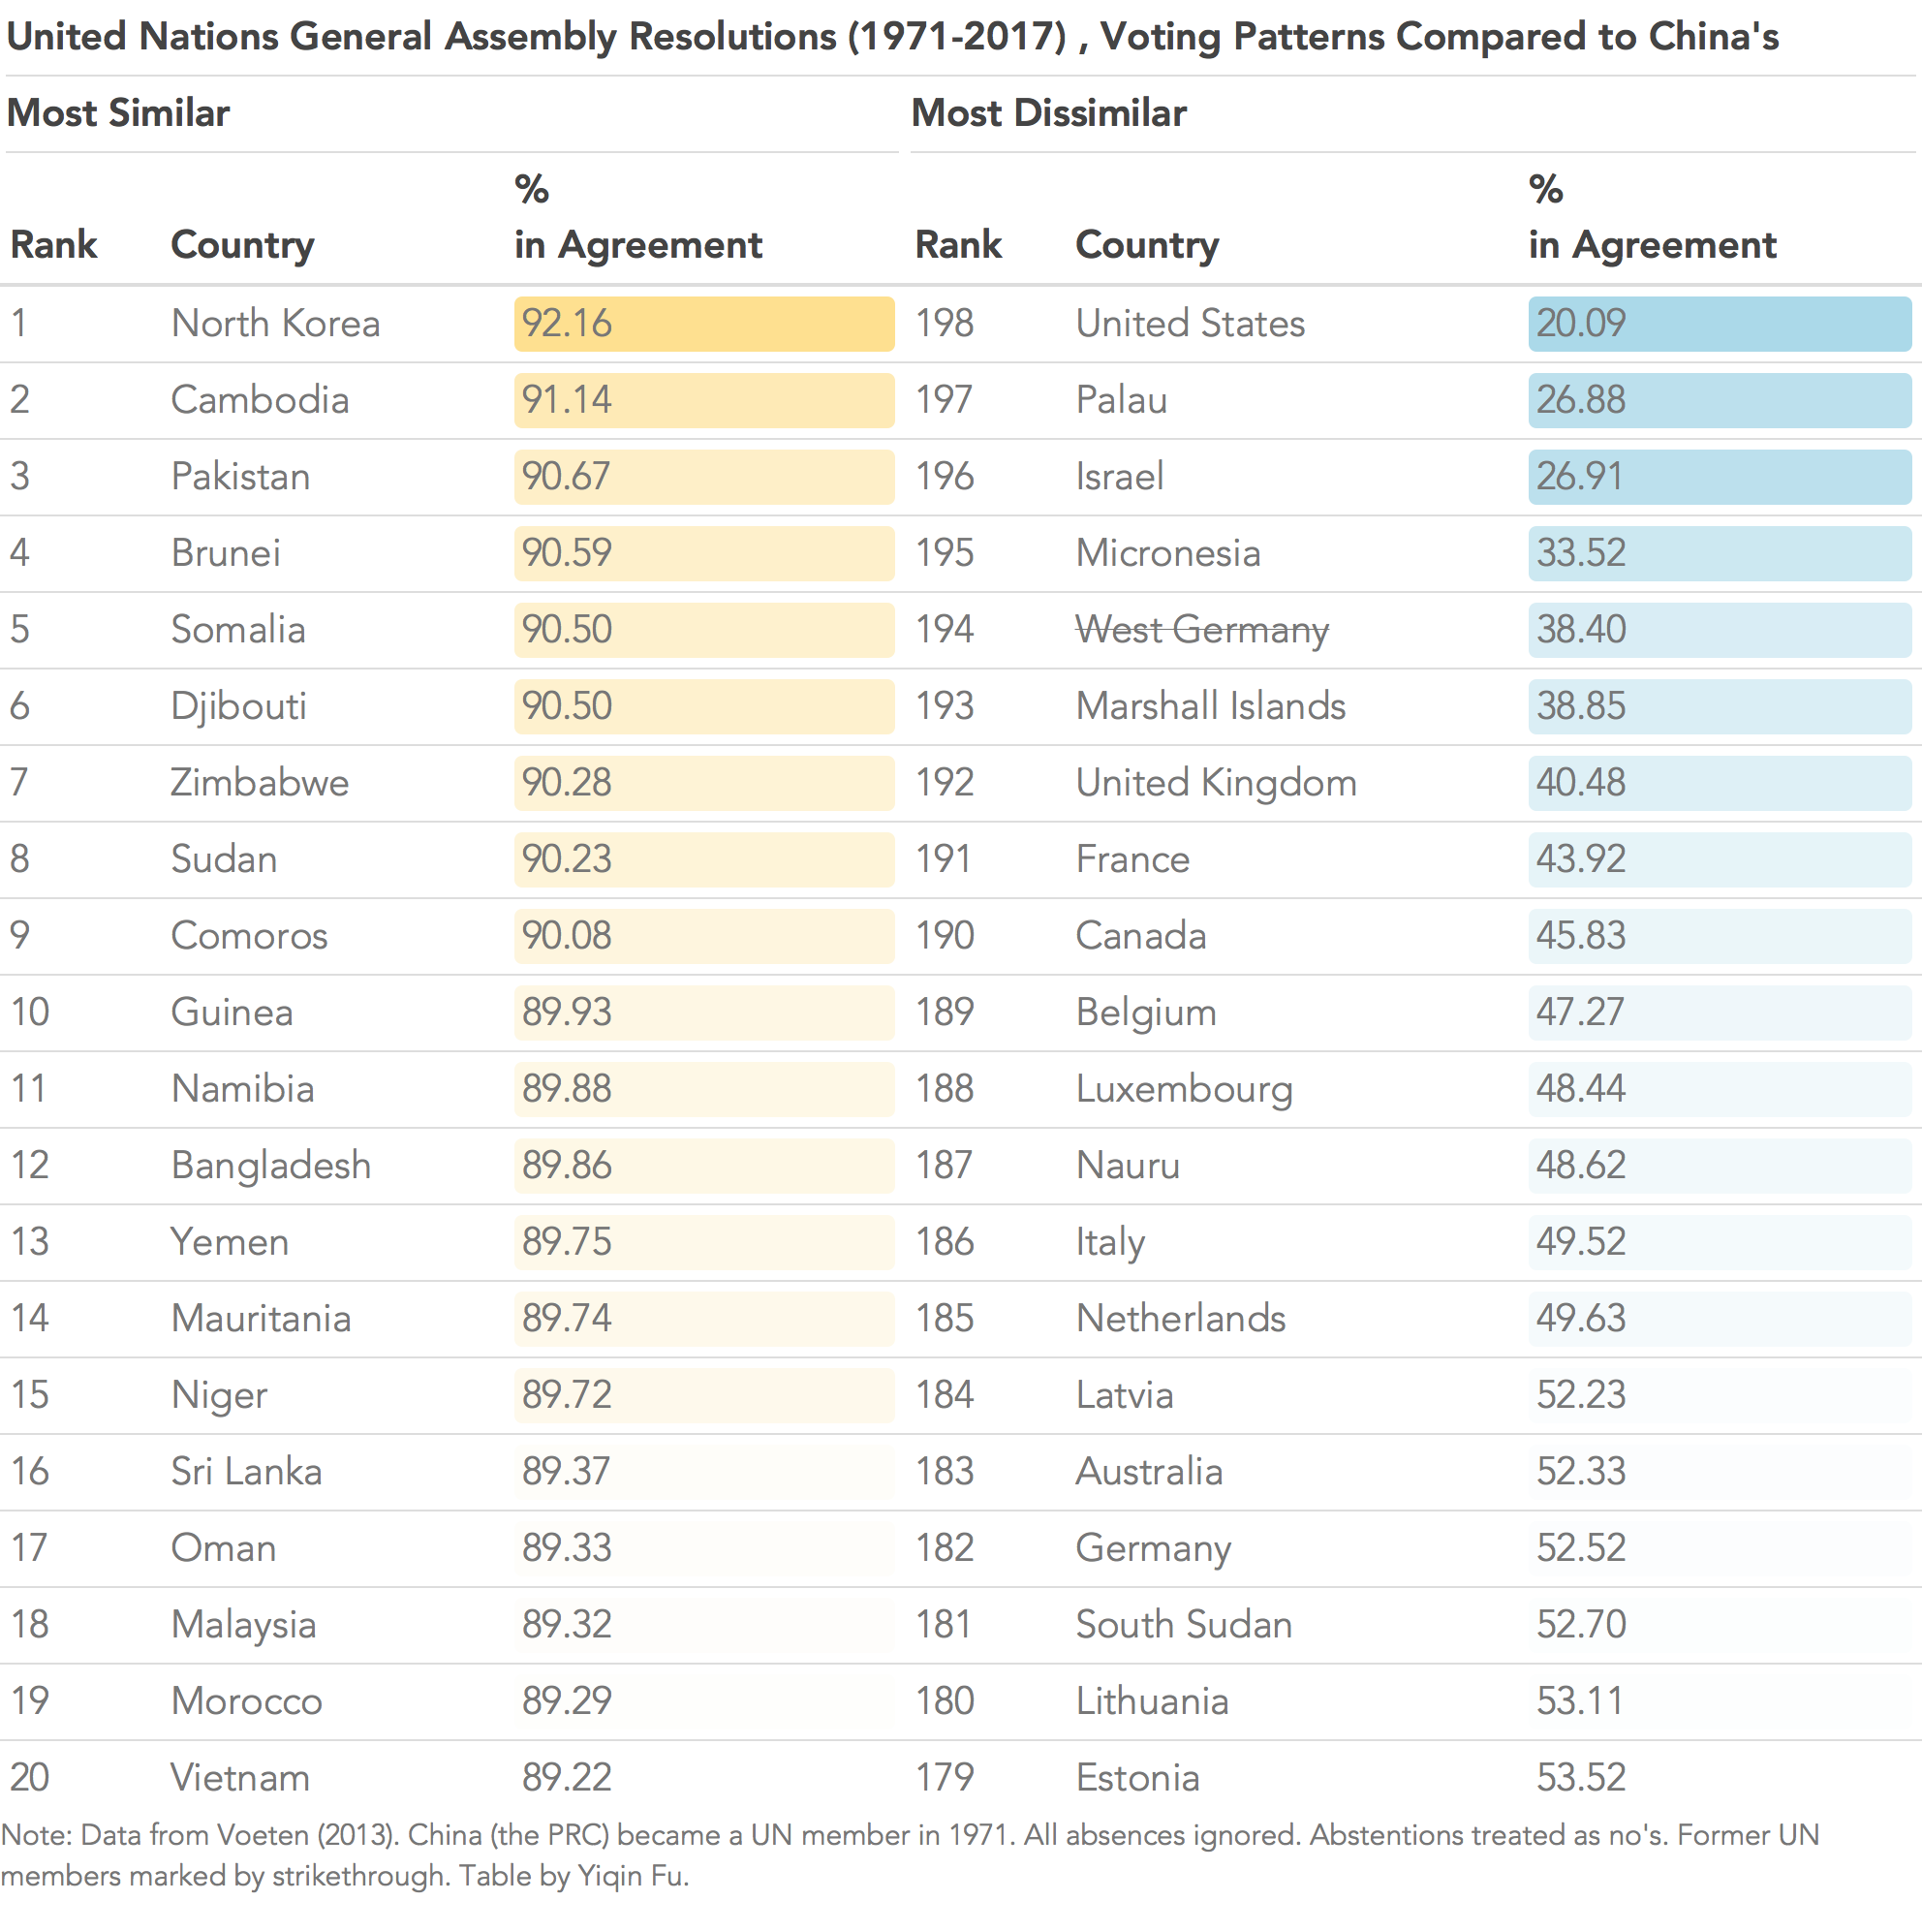
As shown above, since China (the PRC) joined the UN in 1971, North Korea has voted most similarly, and the U.S. most dissimilarly with China. Other names on the list are also broadly as expected, with Cambodia and Pakistan coming in second and third. Djibouti, where China set up its first overseas military base in 2016, is also high up on the list.
Next, if we focus on the post-Cold War era, we obtain a different list of countries:
(Here I further narrow the votes to those marked “important” by the U.S. State Department. But results are similar if we do not filter by this condition.)
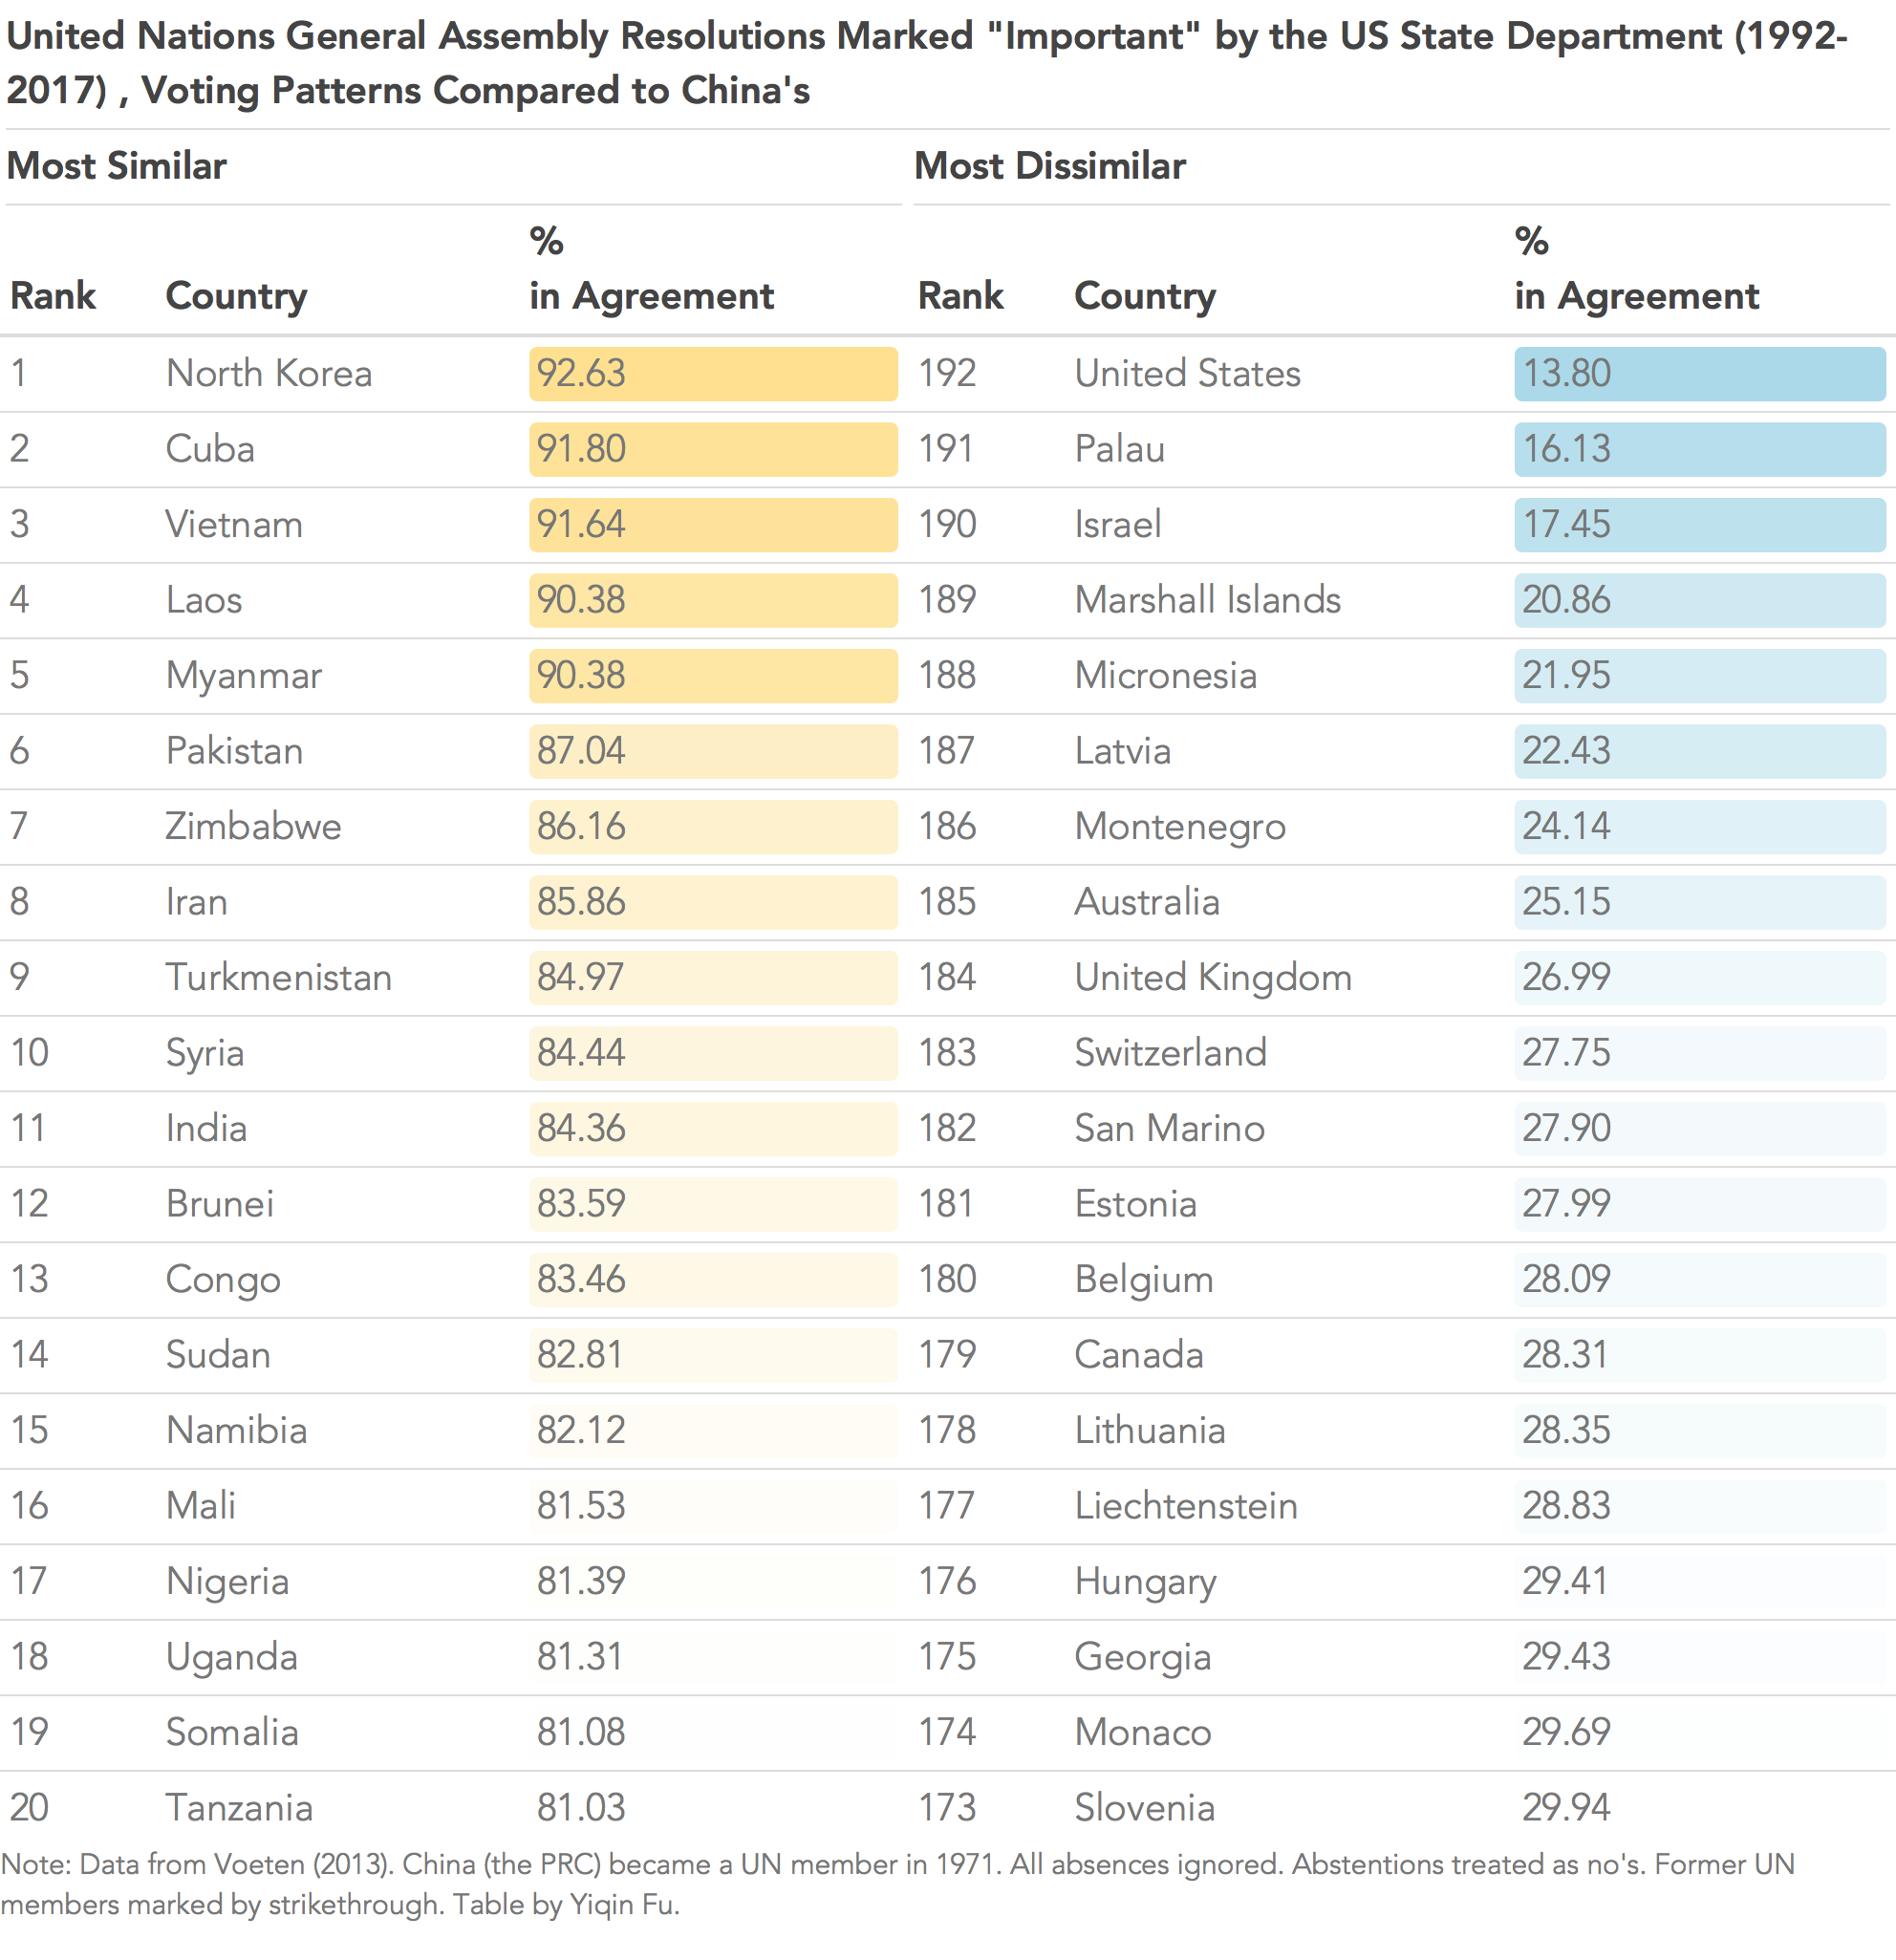
I find India’s position on the list (11th most similar) surprising, since China and Pakistan are thought to be close allies, and India is far from an ally of Pakistan. Based on UNGA voting patterns, however, both countries are close to China, implying that they are prima facie close to each other as well.
An Indian scholar’s analysis explains why. Apparently India has historically sided with Palestine on Israel-Palestinian issues, most recently voting for a UNGA resolution that declared U.S. recognition of Jerusalem as Israel’s capital “null and void.” Since Israel-Palestinian issues make up almost a fifth of UNGA resolutions, it is no surprise that India and Pakistan vote similarly and that both are similar to China.
By the same token, one of the reasons Israel shows a very similar voting pattern to the U.S. is that Israel-Palestinian issues are prominently featured on the UNGA voting agenda.
Caveats
Before we move on, it is important to note the limitations of this dataset. First, UNGA resolutions, unlike those of the Security Council1, are non-binding. Although the 200 or so UNGA members frequently vote on hot-button issues such as North Korea, Crimea, and the Israel-Palestinian conflict, their votes are more symbolic in nature. As Donald McHenry, a former US permanent UN representative said, “[the UNGA] is not an action body. It is just that – an assembly.” More significant UNGA resolutions include the Universal Declaration of Human Rights (1948) and the Millennium Declaration (2000).
Another major limitation is that UNGA votes reflect only nations' stances on major multilateral issues. By the U.S. State Department’s classification2, 18% of UNGA votes are related to the Israel-Palestinian conflict. Thus, bilateral conflicts such as territorial or trade disputes would not be reflected in this dataset.
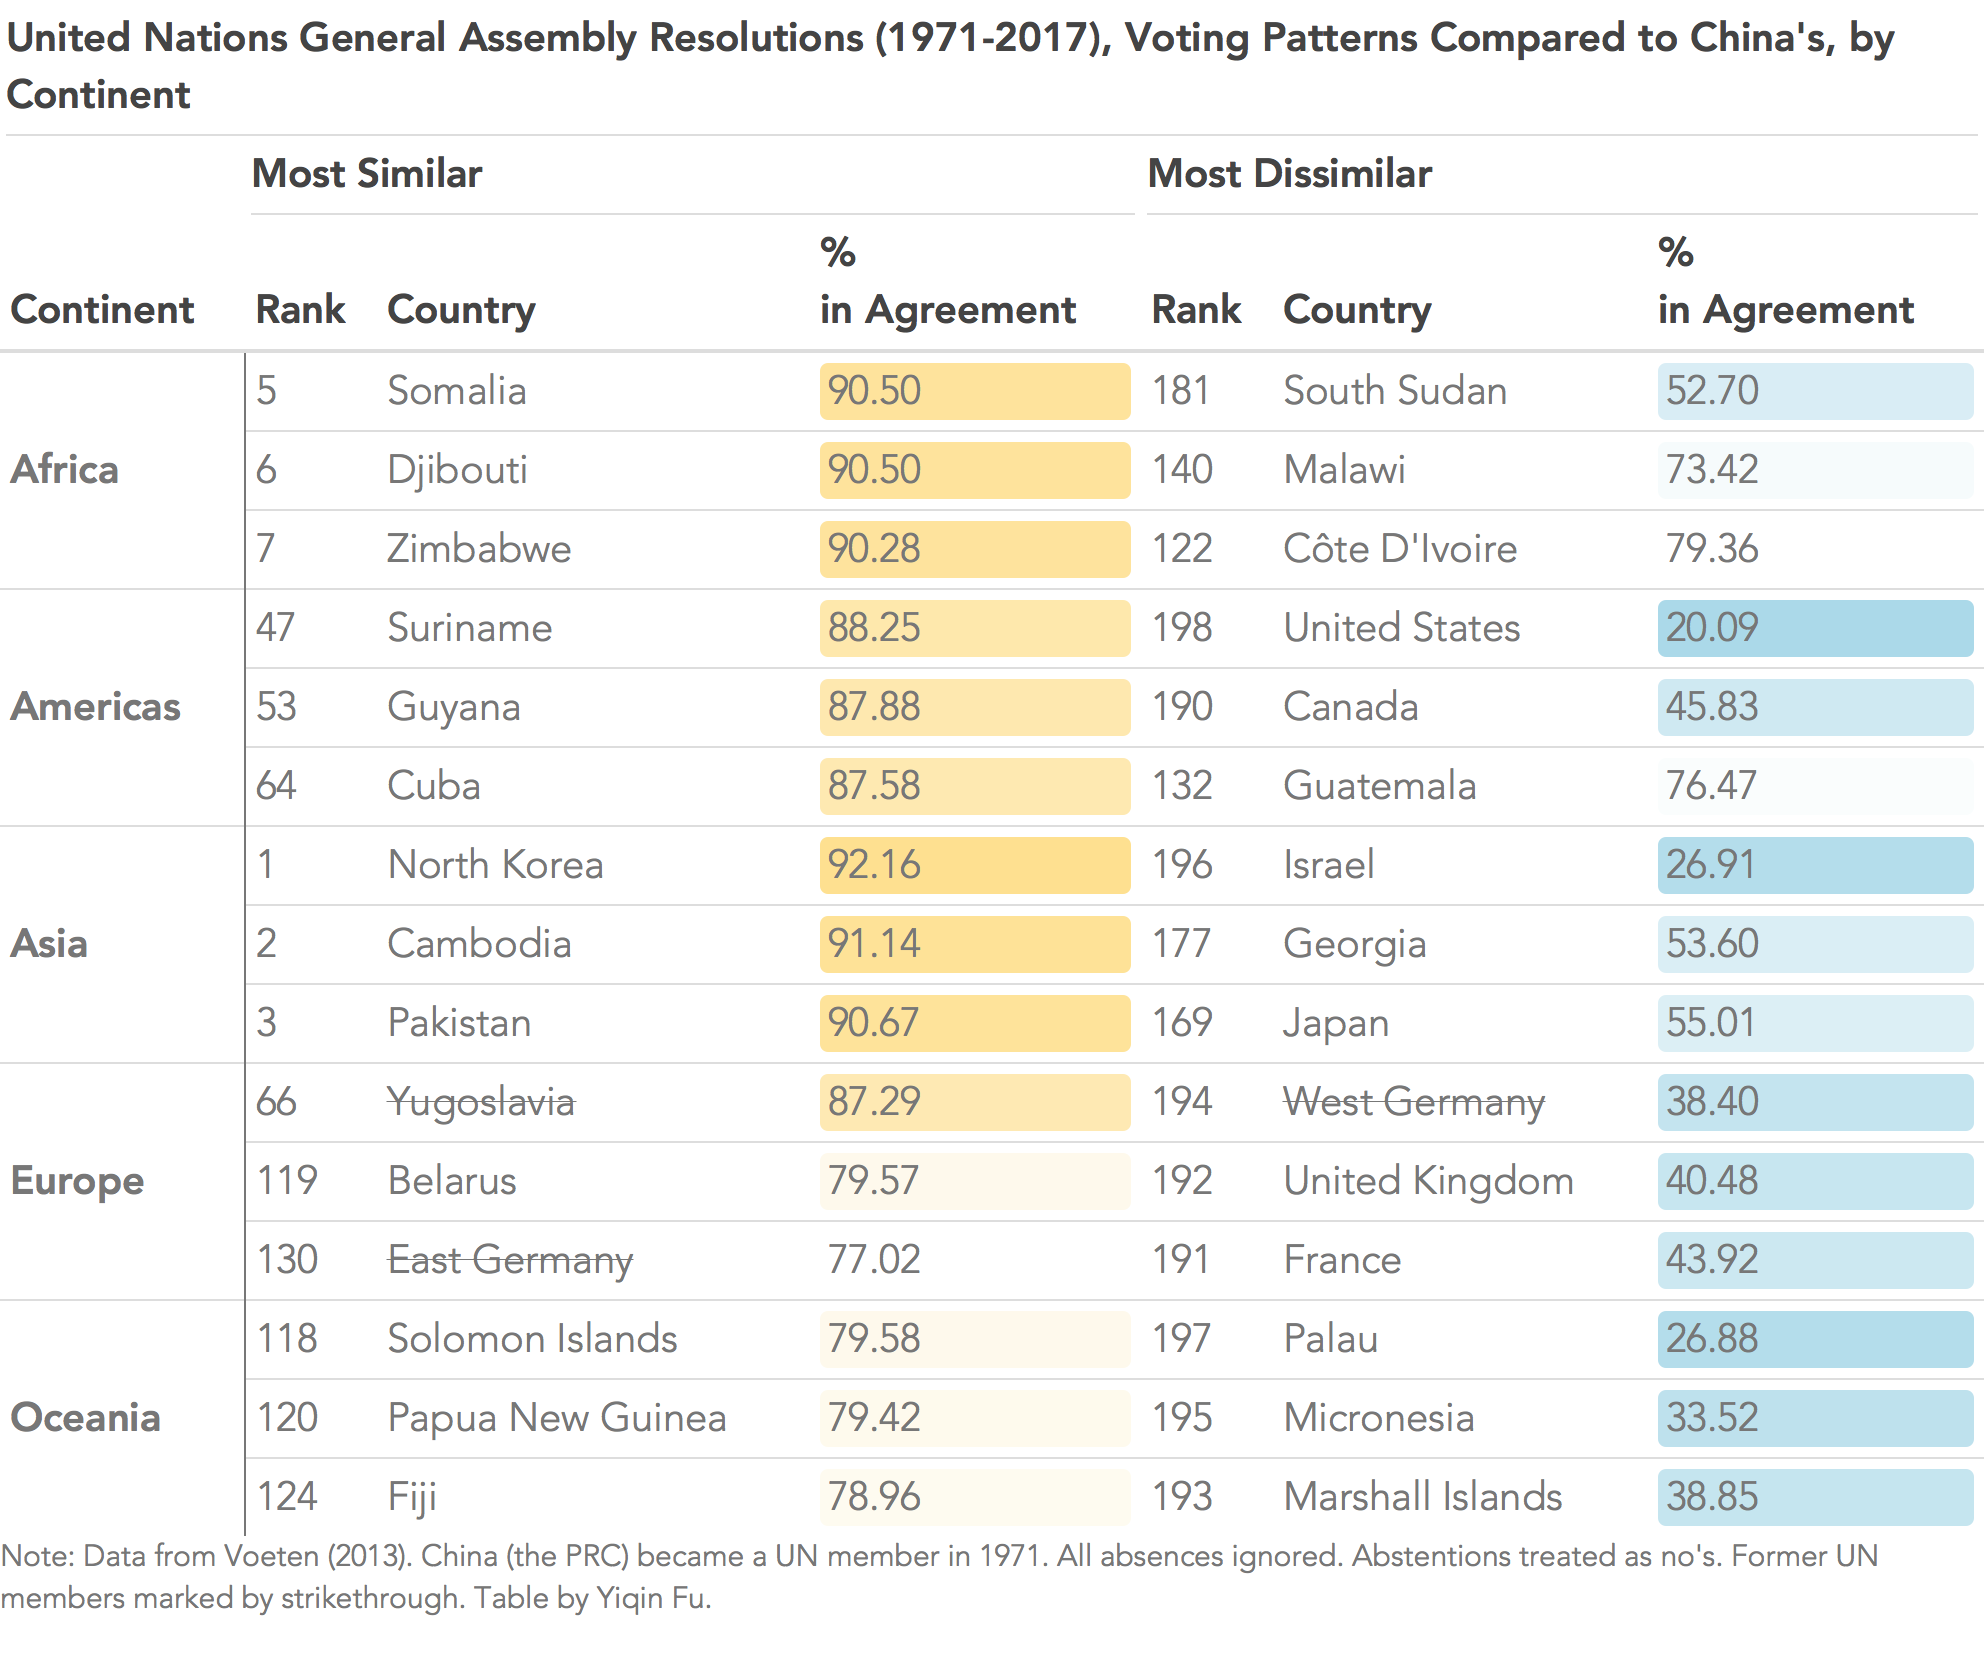
Most Similar and Dissimilar to China, by Continent
Going back to correlation with China’s voting patterns, we can tabulate the most similar and dissimilar by continent:
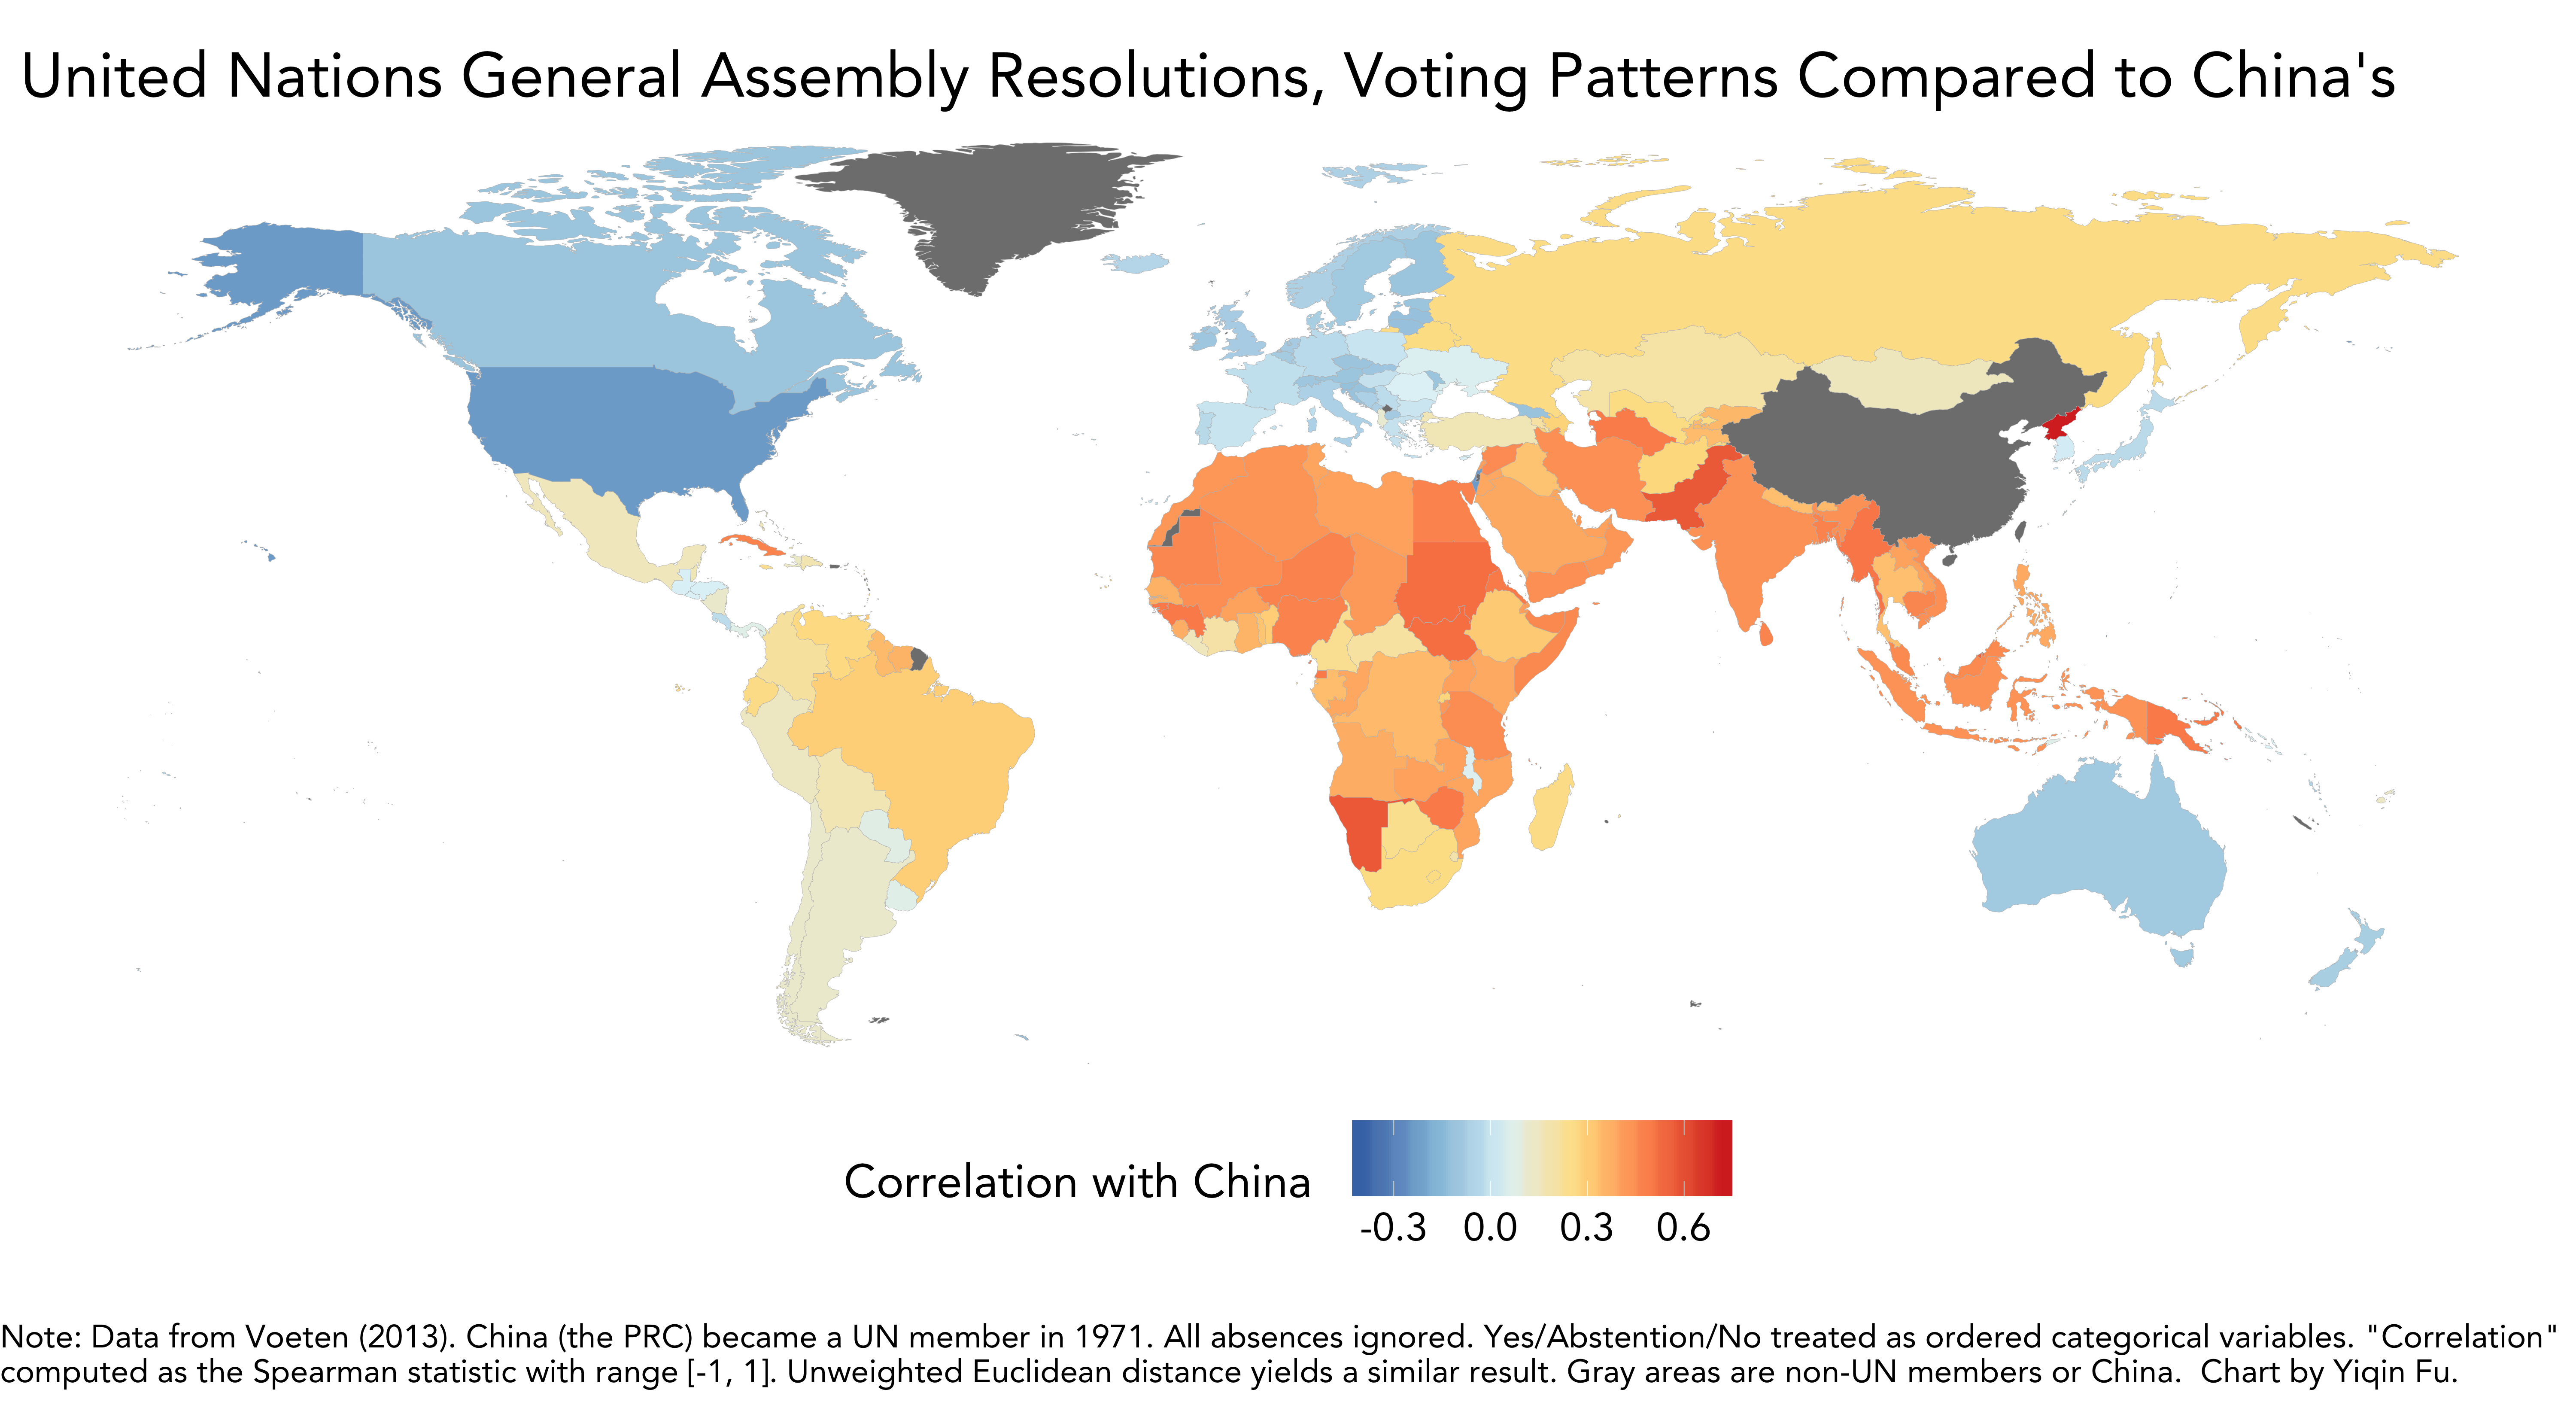
The continental divide is illustrated even more clearly by the world map below:
Rather than charting each country’s percentage of votes consistent with China’s, here we calculate the correlation statistic between each country’s voting record. Regardless of the calculation method used though (simple percentages, correlation statistic, Euclidean distance), the ranking of countries remains largely unchanged.
Closest and Farthest Apart Country-Pairs Overall
We can perform the same exercise for each pair of UN member countries. In total, there are around 9,800 country-pairs, and the most and least correlated ones are:
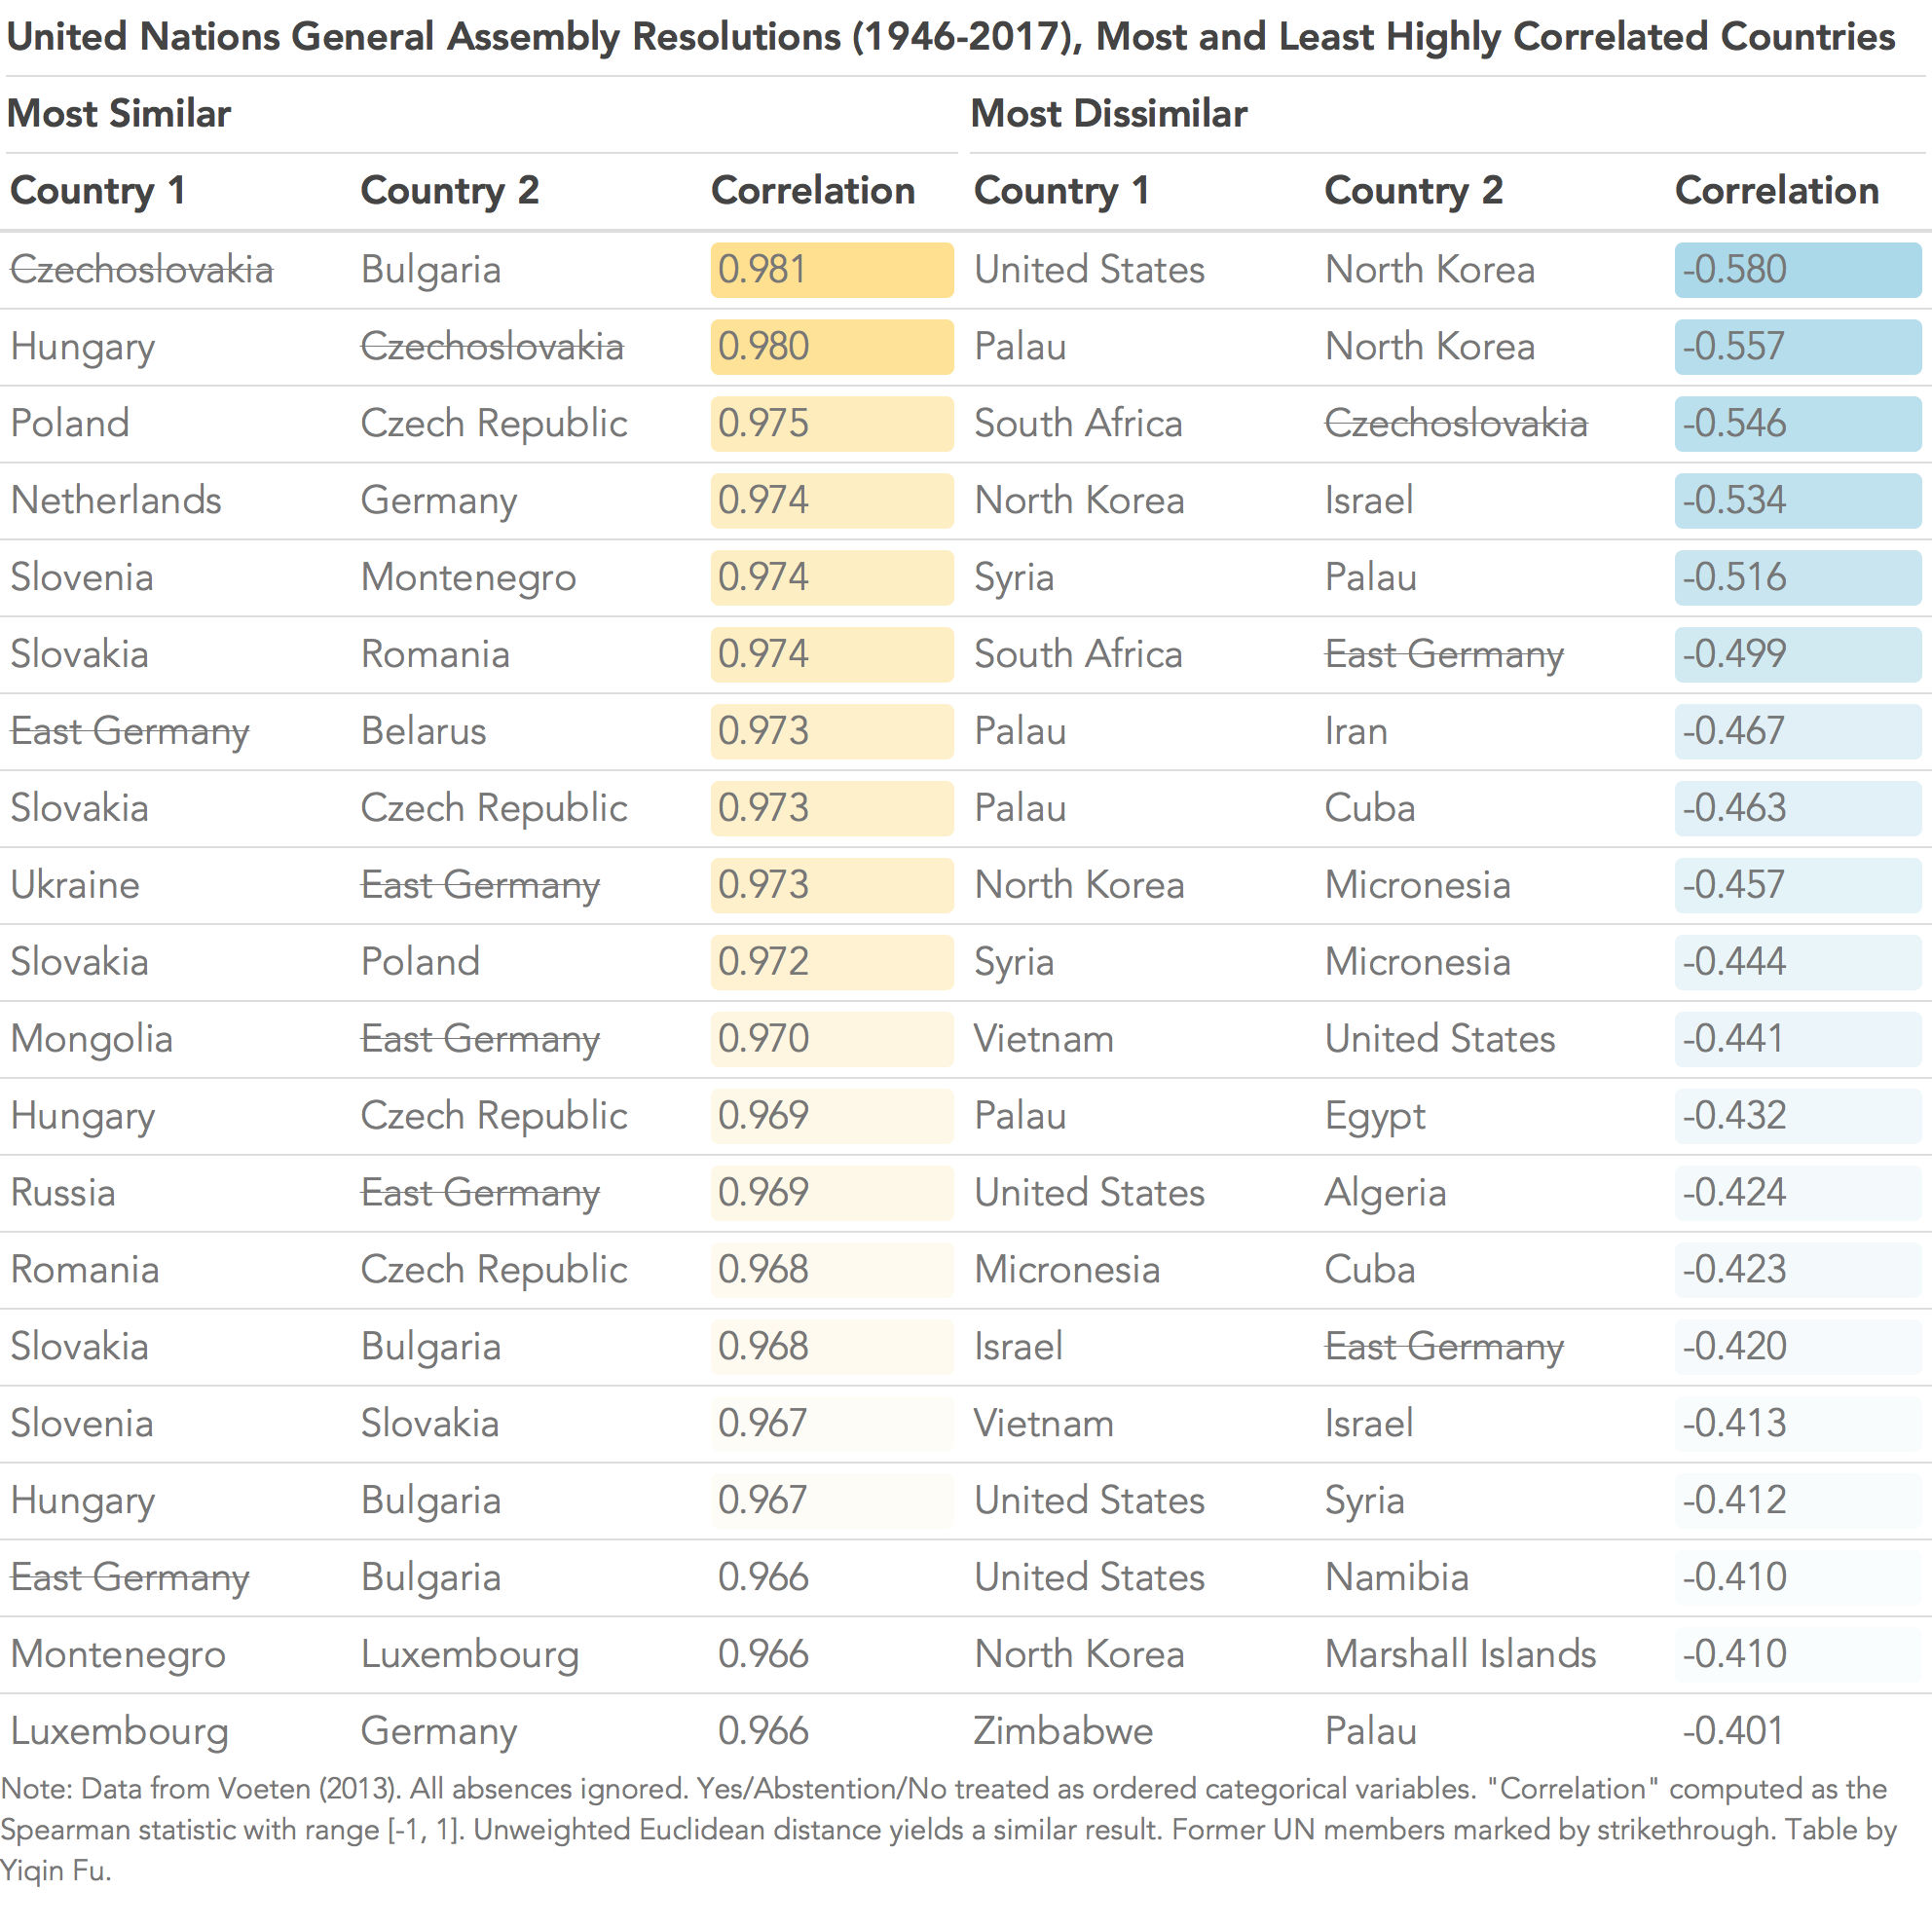
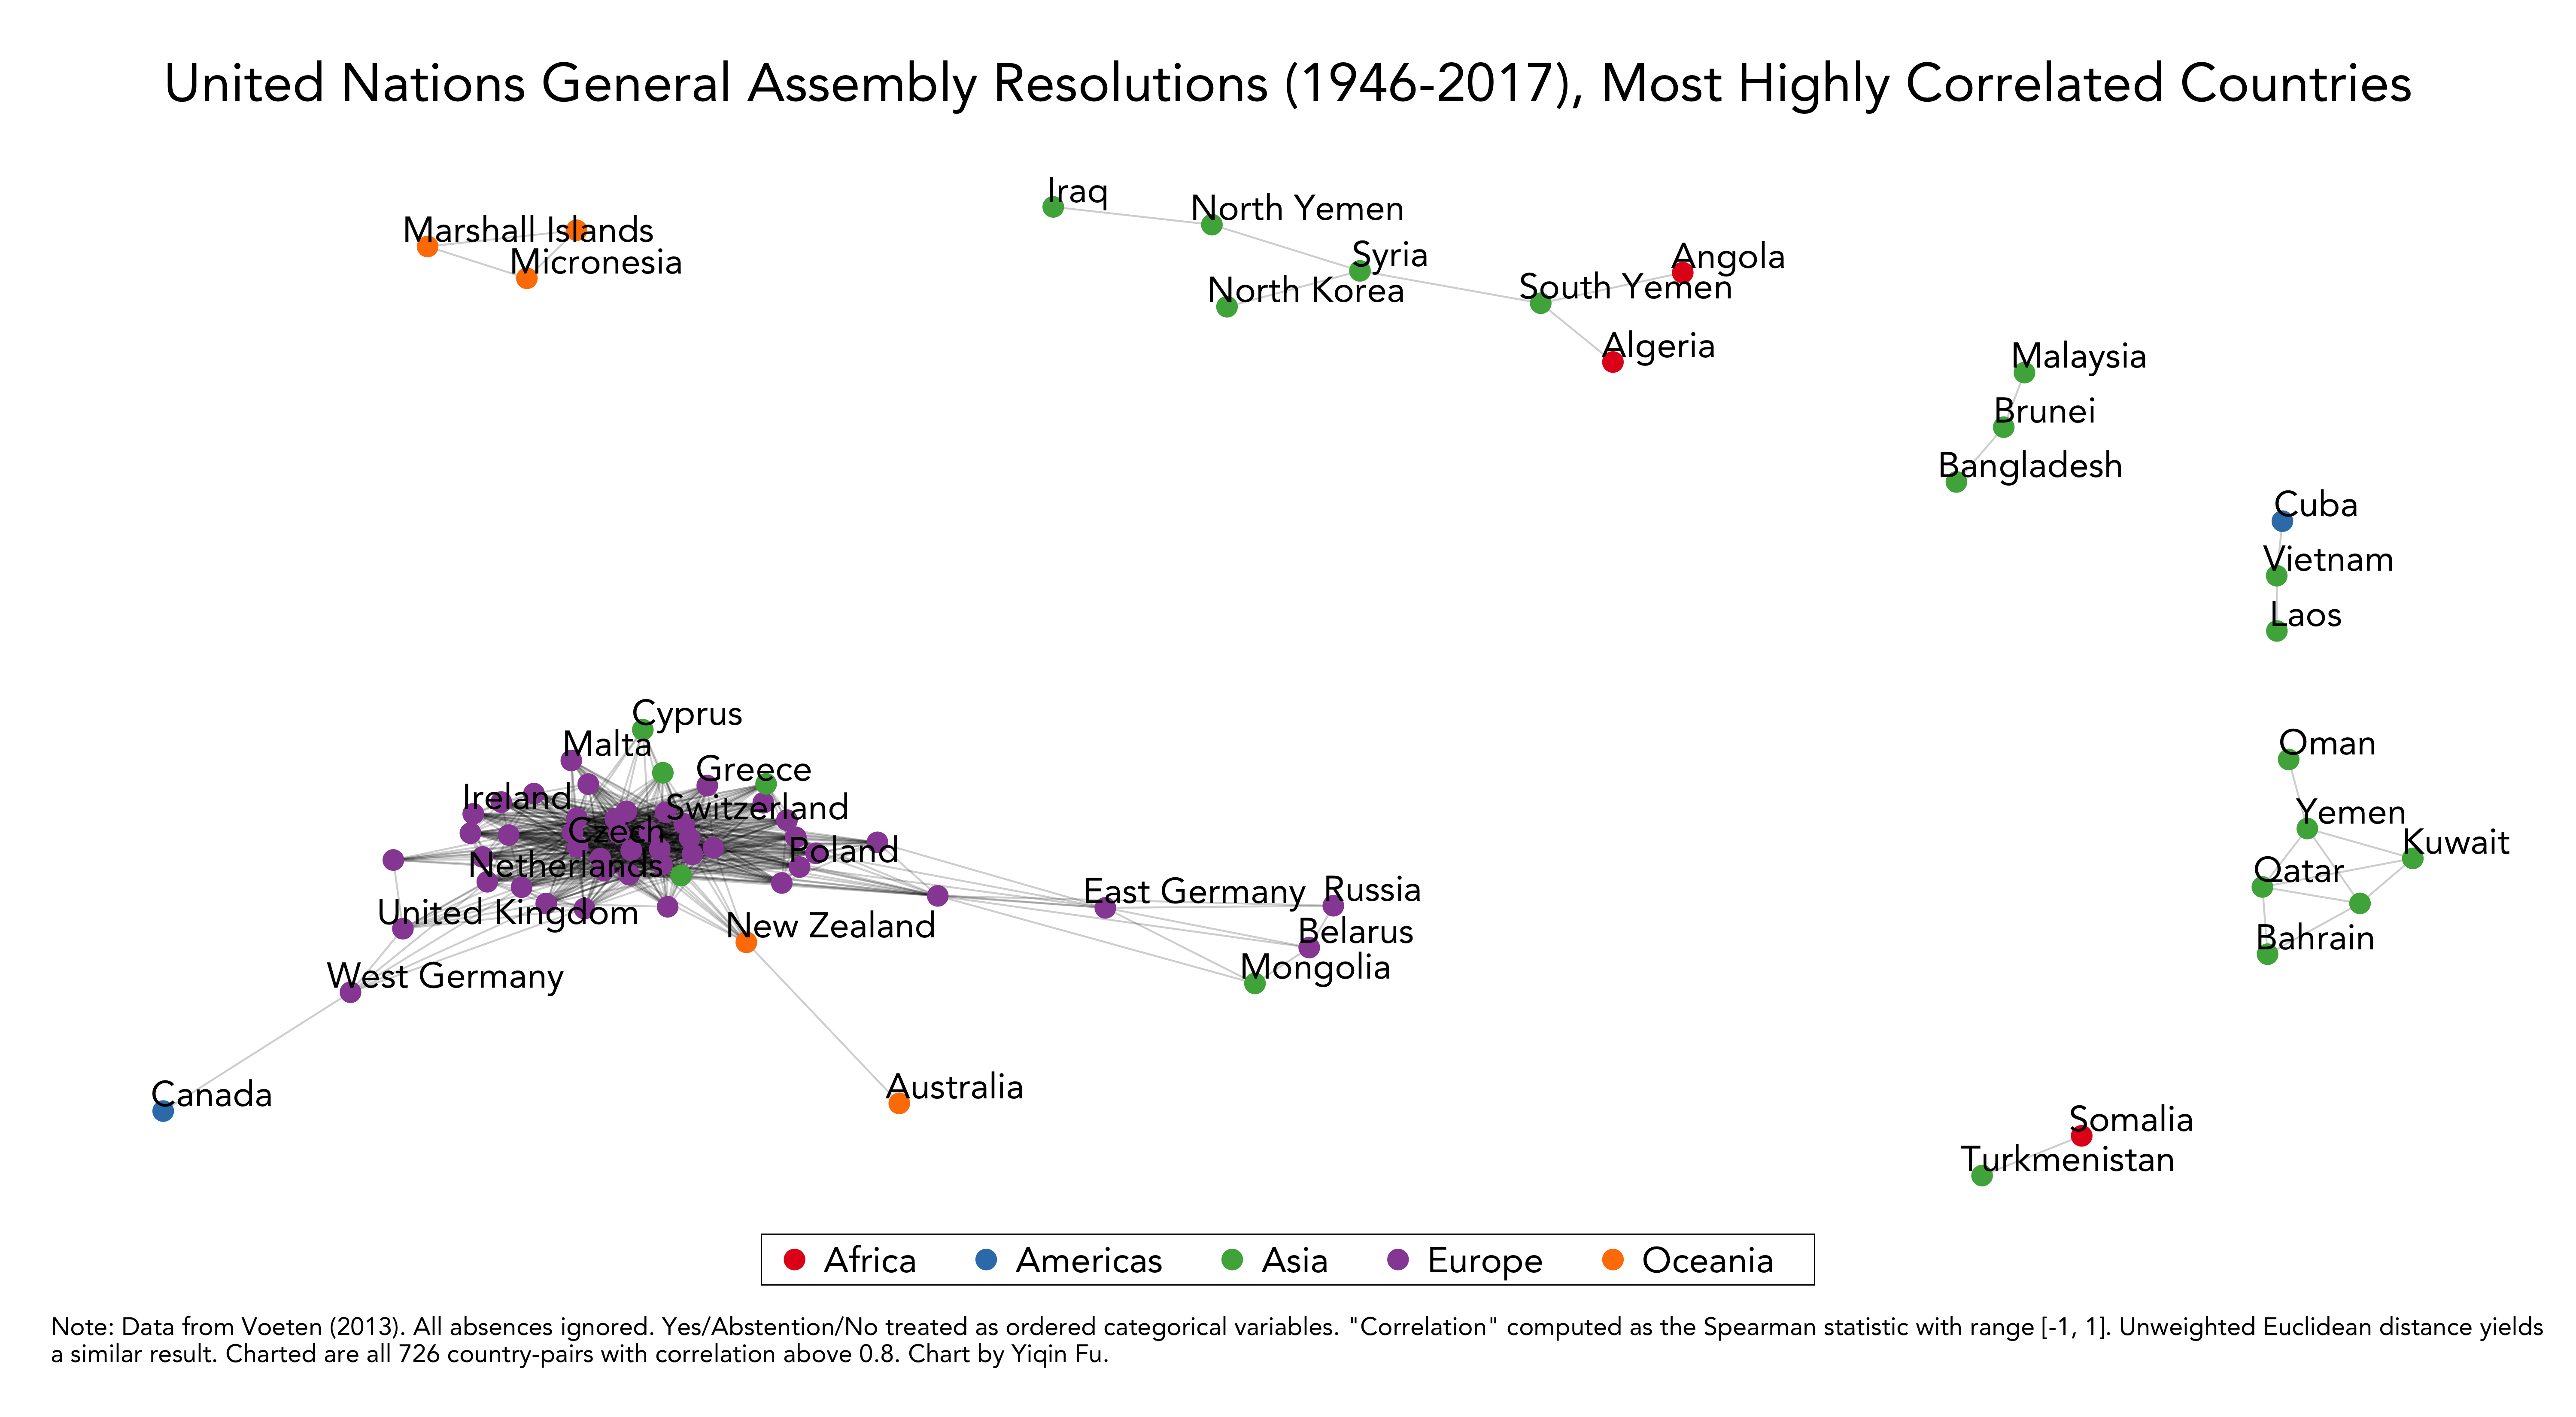
The left-hand side (i.e. highly correlated pairs) is made up exclusively of European countries. We can plot all country-pairs whose correlation statistic is above 0.8 (the maximum being 1). As shown below, if a country has a correlation statistic of 0.8 or higher with another country, the two dots are connected. The large blob of purple dots on the lower left is exclusively European.
To further confirm our hypothesis (and the conventional wisdom) that European countries vote as a block, we plot the density distribution of all same-continent country-pairs' correlation statistics:
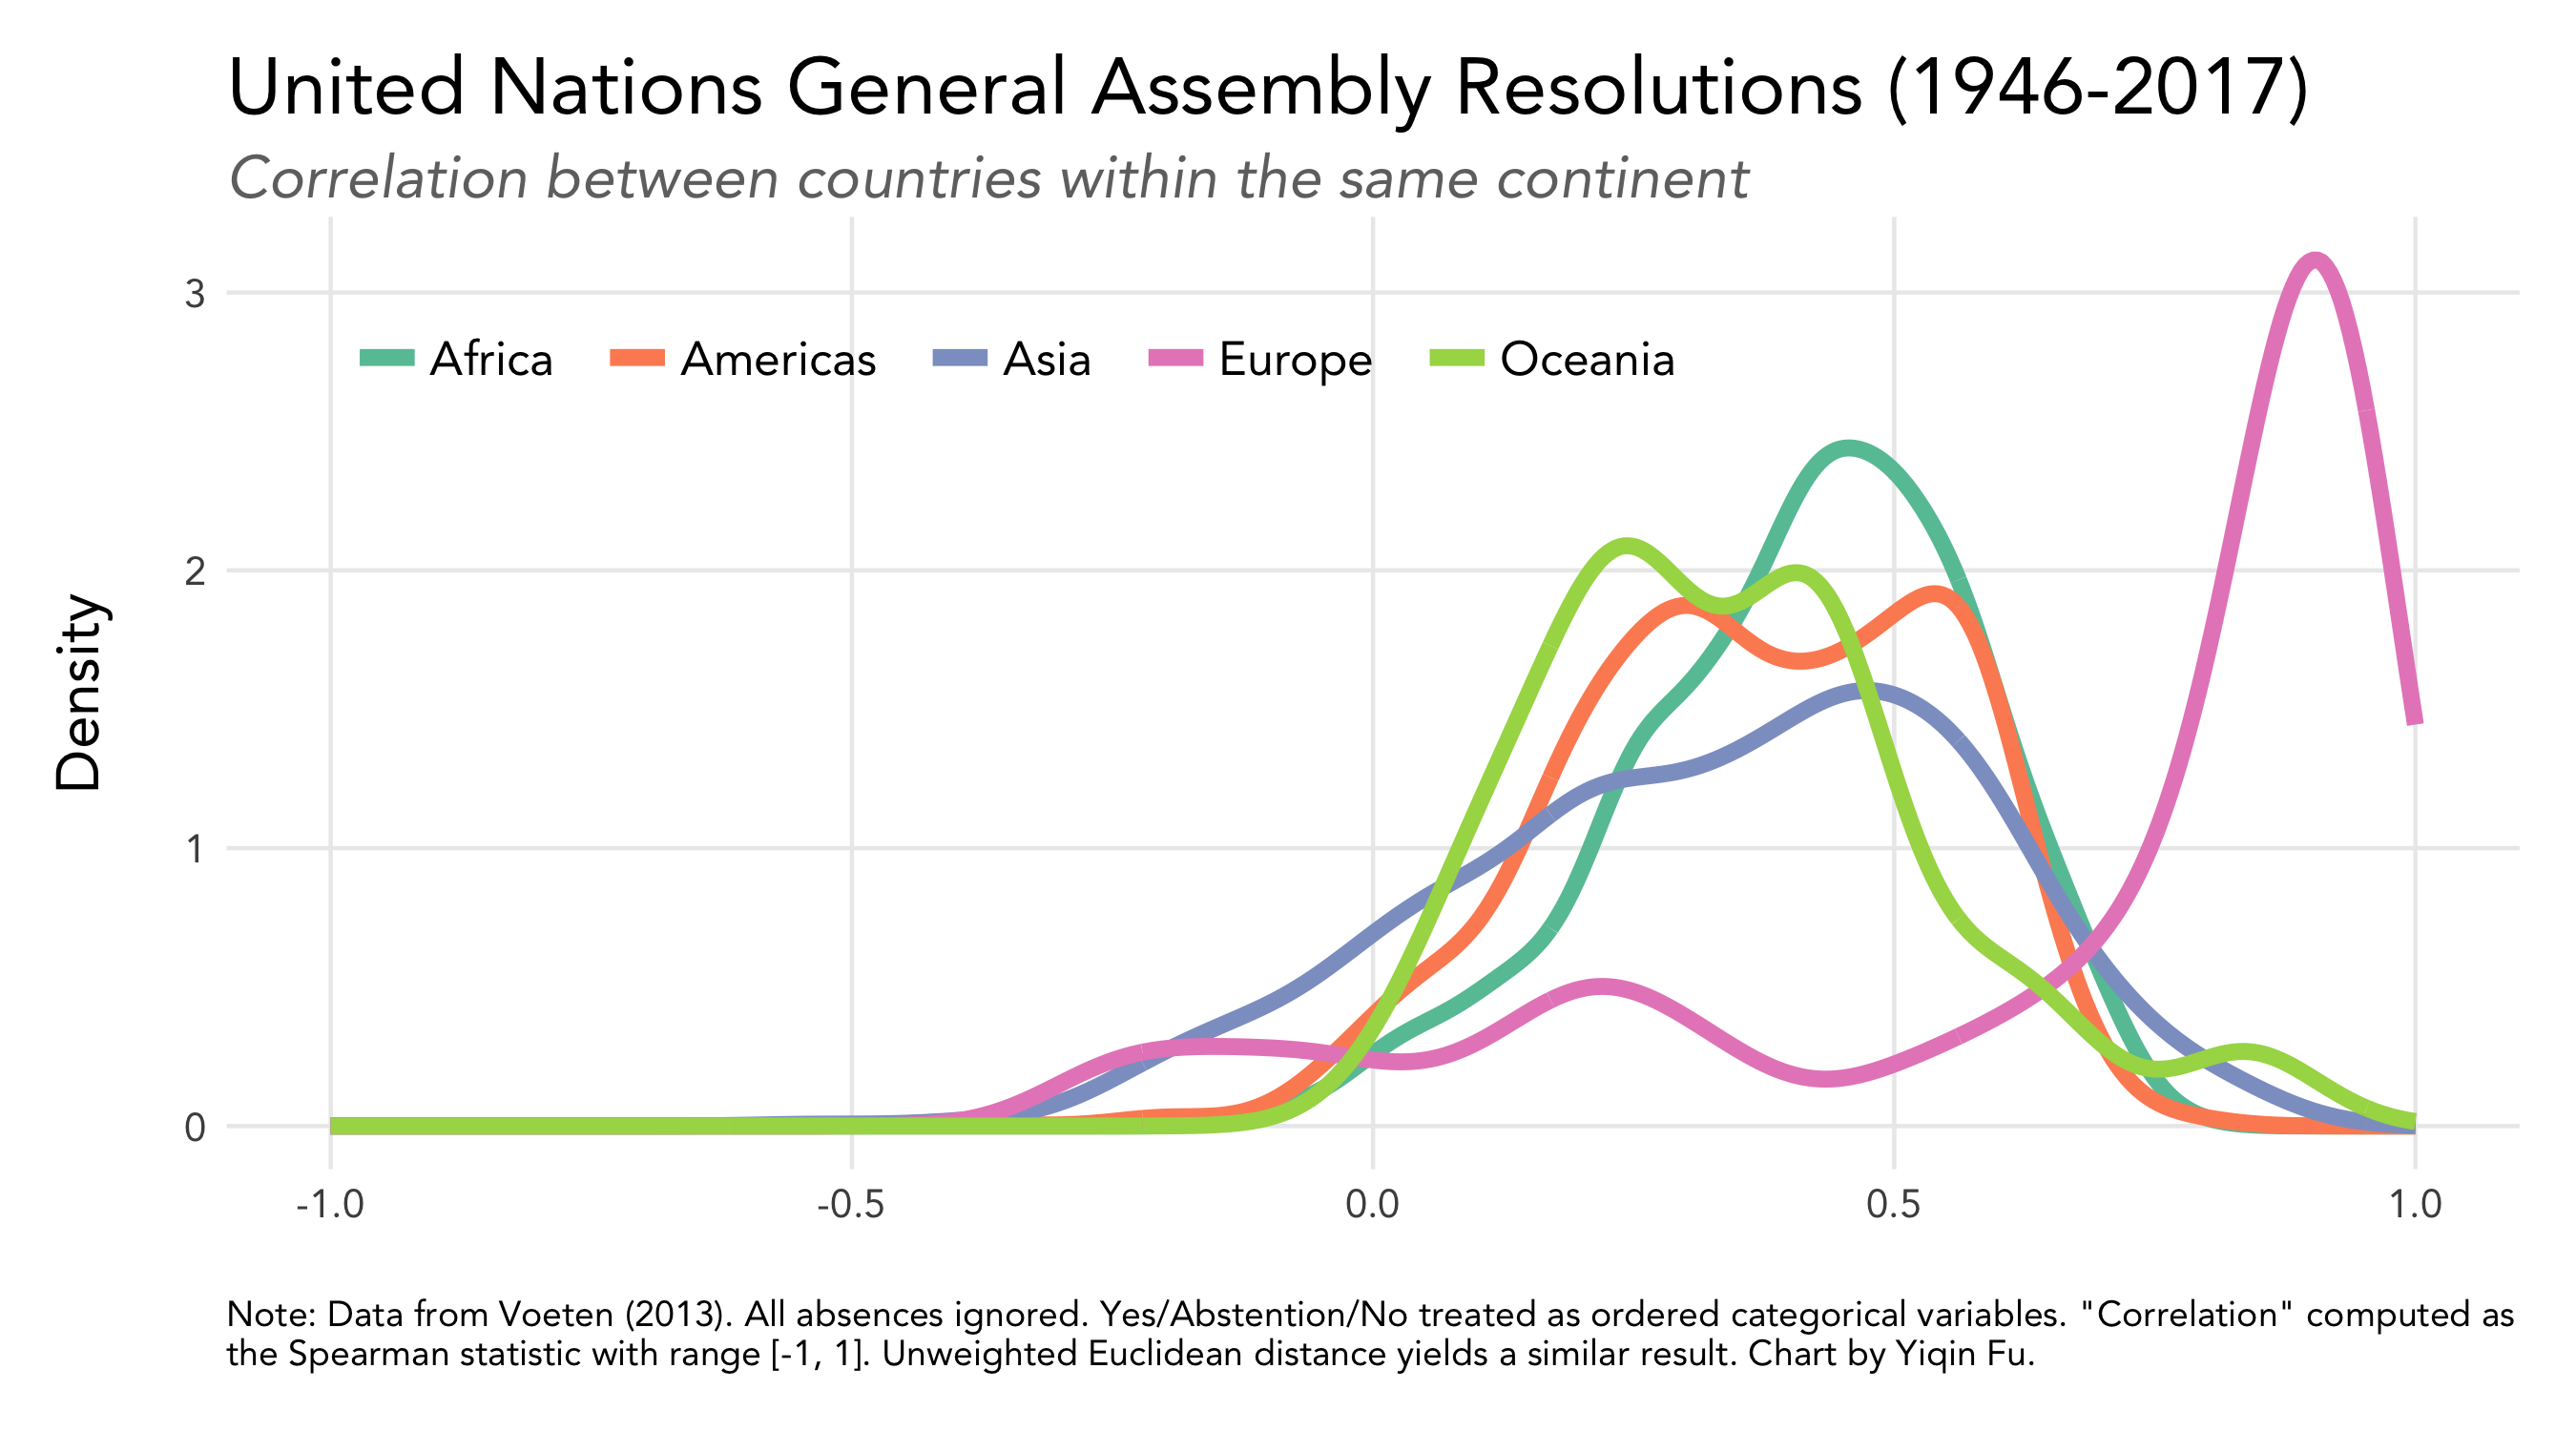
As shown above, most European countries' correlation statistics with other European countries falls between 0.8 and 1, a distinct pattern not seen in other continents' country-pairs.
The y-axis of density distribution plots is not intuitive, so we can summarize the data in another, more easily interpretable way. The table below shows that 68% of Europe’s country-pairs have a correlation statistic of 0.7 or higher (the maximum correlation being 1), while other continents are in the single digits by this measure.
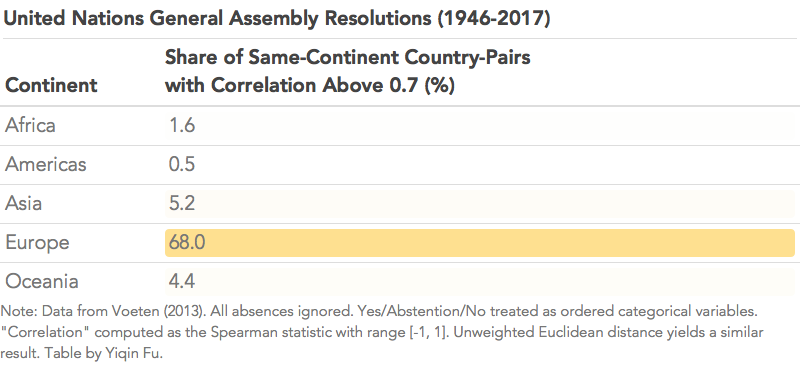
Again, if we calculate country-pair relationships another way (e.g. Euclidean distance), we get a very similar result.
“Ideal Points” Ideology Index
Finally, let us turn to the academic literature. Bailey et al. (2015) notes that assigning each vote the same weight (just like what this article does) yields counter-intuitive conclusions. For example, they find that if we calculate country-pair similarity by traditional measures, the US and the Soviet Union are found to have voted more similarly during periods of the Cold War than after the War.
Thus, the authors propose a one-dimensional “ideal points” measure that seeks to reweigh all resolutions based on how they split the voting countries. The “score” obtained for each year is then normalized by fixing the resolution parameters for similarly worded resolutions within a given time frame.
Their paper does not give enough detail for me to replicate, so I simply chart their normalized data below:
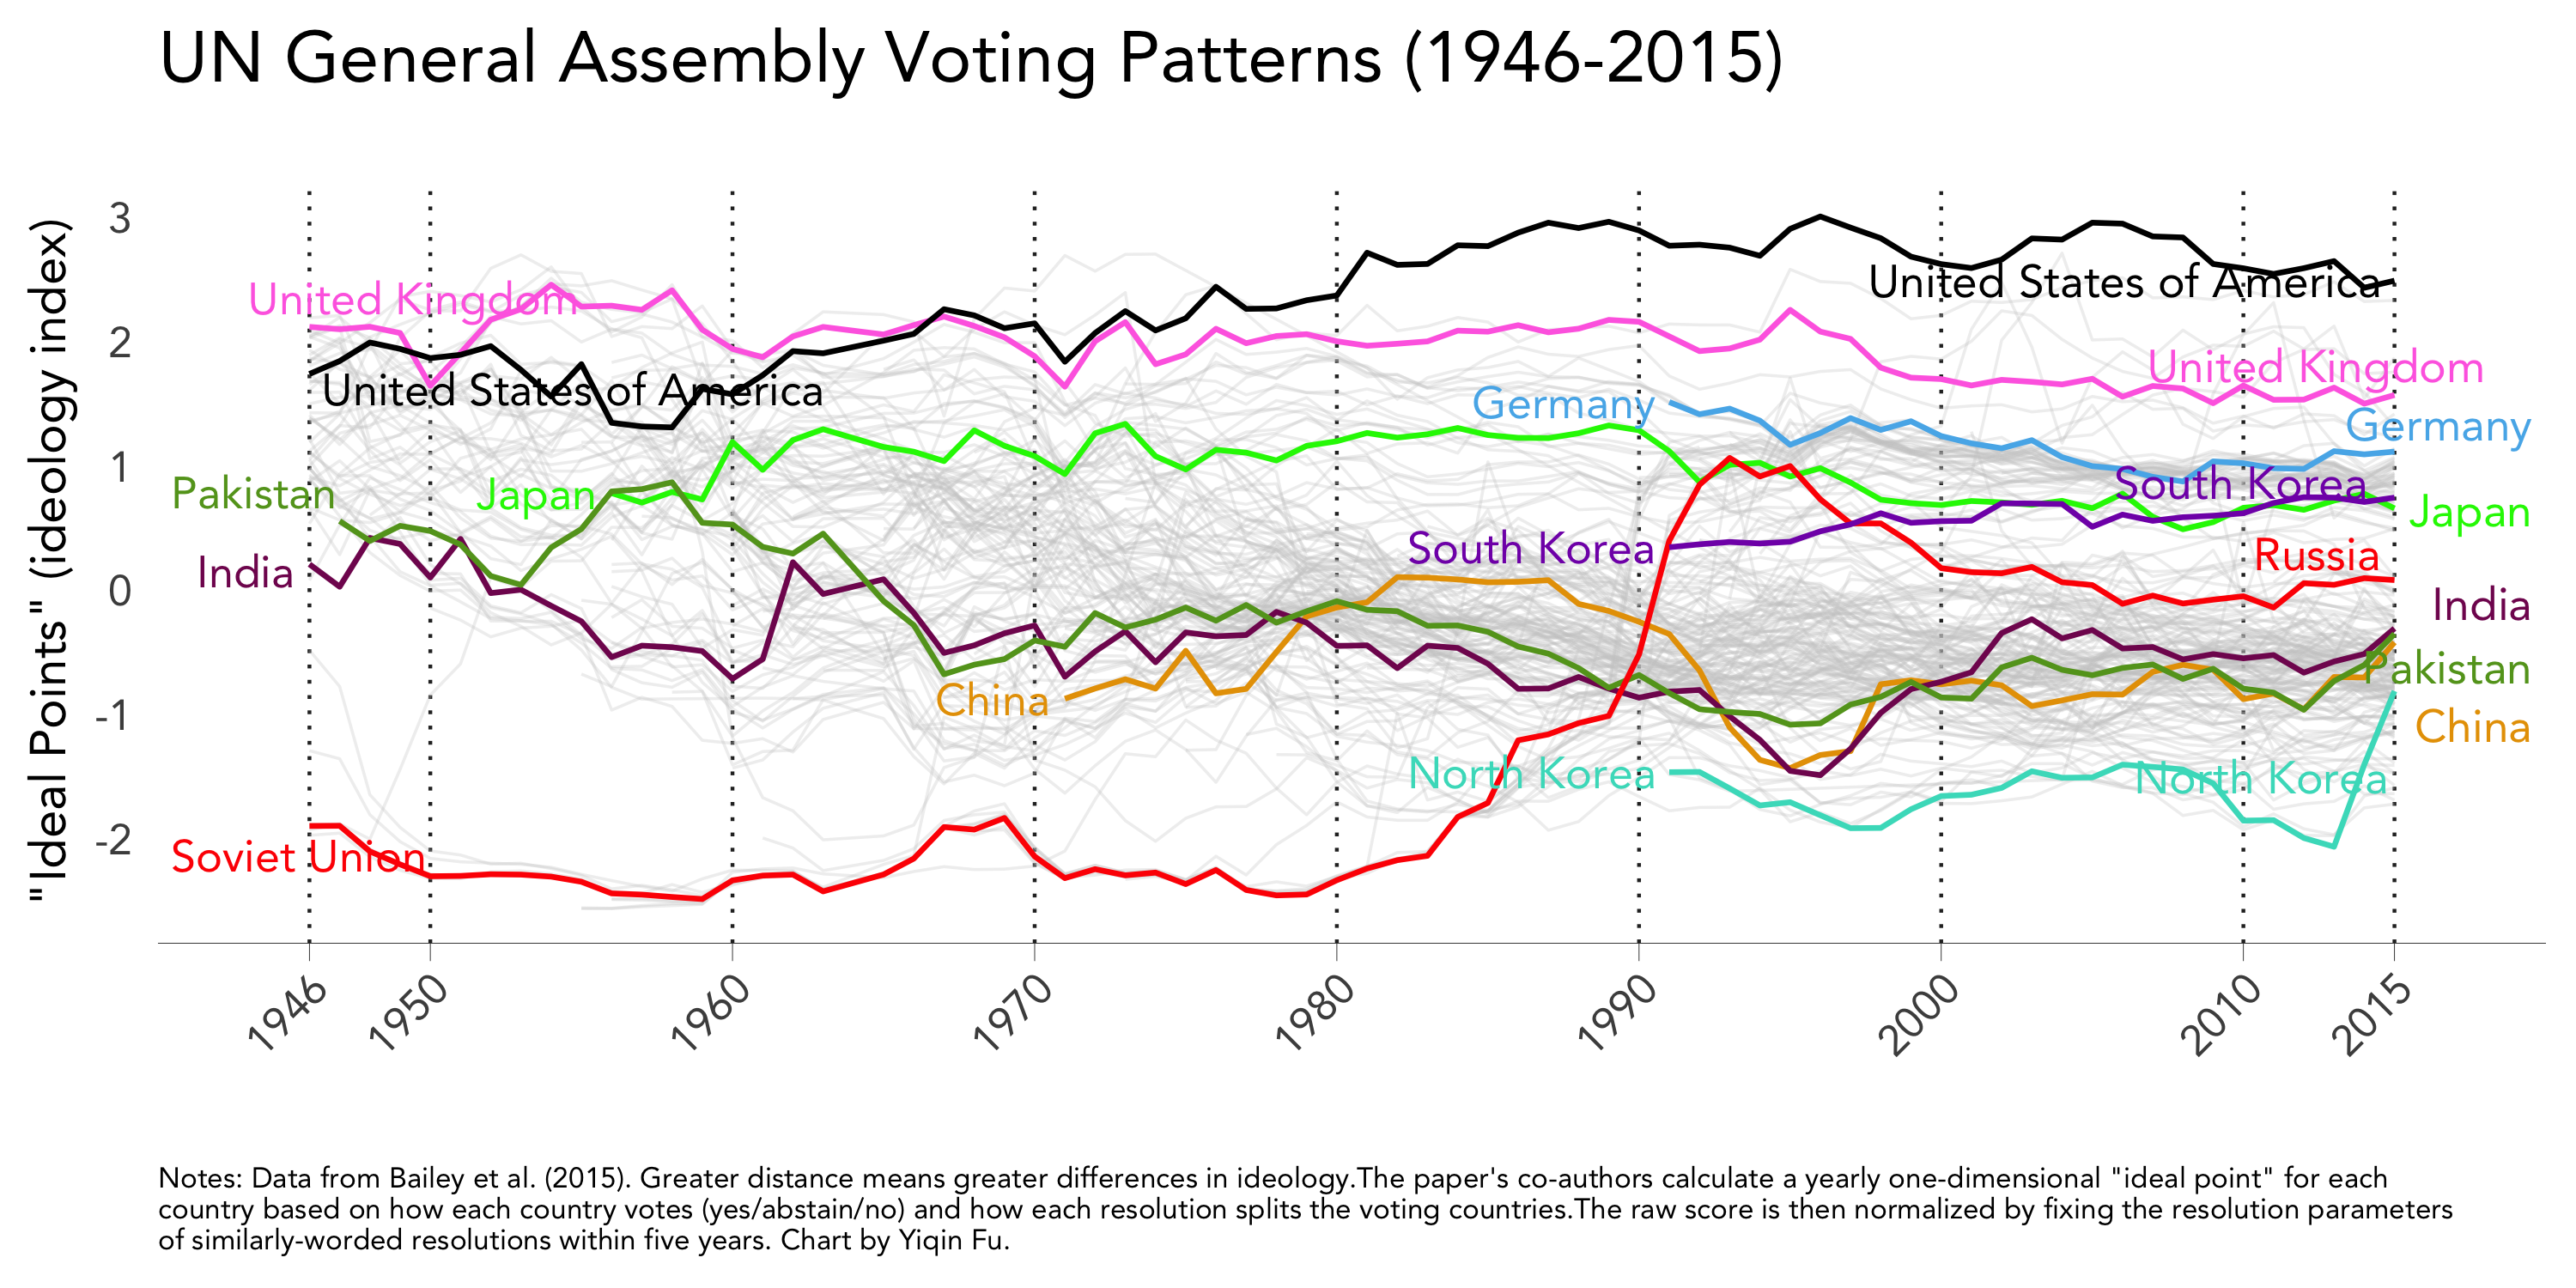
Since the index has been normalized, the absolute value (i.e. the chart’s y-axis) does not have an intuitive interpretation. Instead, the relative distance between countries shows their ideological similarity/dissimilarity.
Professor Michael Bailey and Professor Erik Voeten (creator of the UNGA dataset) have recently published more papers on this topic, so I look forward to learning more ways to quantify the ideological distance between countries and each country’s inter-temporal shifts in ideology.
An Interactive Site
I am in the process of building a simple interactive site (similar to Professor Voeten’s) that allows for custom inputs.
2020 Update: I have built the interactive site here: https://dataviz.yiqinfu.com/unview/.
Note: A Chinese version of this article is available on my Chinese-language blog. After I shared the article on various Chinese social media platforms, one platform where the article gained traction censored the post.
Many thanks to Professor Erik Voeten for making his UNGA data available online and for responding to my emailed questions.
-
Why aren’t we analyzing Security Council voting patterns? Surely the binding decisions are more consequential! Yes, the Security Council votes would be interesting to look at, but 1) the Security Council has only ten other (rotating) members besides China, France, Russia, the U.S., and the U.K. Thus, we cannot obtain a longitudinal dataset on all countries in all years; 2) More importantly, I have not been able to find either a dataset of voting records prepared by other academics or raw data that can be processed in a reasonable amount of time. Recent Security Council meeting minutes are available online, but votes cast are recorded in prose, and the format of the “prose” differs across years. Substantial digitization and data cleaning work is required to transform all voting records from “prose” format to data tables. Furthermore, the UN does not seem to keep a record of failed Security Council resolutions unless a permanent member exercised its veto power. Thus, it is difficult to know whether one has located all past votes. That is why we are looking at the less consequential UNGA votes in this article. Granted, I could be missing something here, since I do not work in international relations. Please correct me if you see anything wrong or know of a way to get the Security Council data! ↩︎
-
The US State Department began classifying UNGA votes in 1984. ↩︎